Editor’s note: Please welcome guest author Lowell! He’s a prolific contributor to the Match Charting Project, and the author of the first guest post on this blog.
The Problem
Quantifying aggression in tennis presents a quandary for the outsider. An aggressive shot and a defensive shot can occur on the same stroke at the same place on the court at the same point in a rally. To know whether one occurred, we need information on court positioning and shot speed, not only of the current shot, but the shots beforehand.
Since this data only exists for a fraction of tennis matches (via Hawkeye) and is not publicly available, using aggressive shots as a metric is untenable for public consumption. In a different era, net points may have been a suitable metric, but almost all current tennis, especially women’s tennis, revolves around baseline play.
Net points also can take on a random quality and may not actually reflect aggression. Elina Svitolina, according to data from the Match Charting Project, had 41 net points in her match against Yulia Putintseva at Roland Garros this year. However, this was not an indicator of Svitolina’s aggressive play so much as Putintseva hitting 51 drop shots in the match.
The Match Charting Project does give some data to help with this problem however. We can use the data to get the length of rallies and whether a player finished the point, i.e. he/she hit a winner or unforced error or their opponent hit a forced error. If we assume an aggressive player would be more likely to finish the point and would be more likely to try to finish the point sooner rather than later in a rally, we can build a metric.
The Metric
To calculate aggression using these assumptions, we need to know how often a player finished the point and how many opportunities did they have to finish the point, i.e. the number of times they had the ball in play on their side of the net. To measure the number of times a player finished the point, we add up the points where they hit a winner or unforced error or their opponent hit a forced error. For short, I will refer to these as “Points on Racquet”.
To measure how many opportunities a player had to finish the point, we calculate the number of times the ball was in play on each player’s side of the net. For service points, we add 1 to the length of each rally and divide it by 2, rounding up if the result is not an integer. For return points, we divide each rally by 2, rounding up if the result is not an integer. These adjustments allow us to accurately count how often a player had the ball in play on their side of the net. For brevity, I will call these values “Shot Opportunities”.
If we divide Points on Racquet by Shot Opportunities we will get a value between 0 and 1. If a player has a value of 0, they never finish points when the ball is on their side of the net. If the player has a value of 1, they only hit shots that end the point. As the value increases, a player is considered more aggressive. For short, I will call this measure an “Aggression Score.”
The Data
Taking data from the latest upload of the Match Charting Project, I found women’s players with 2000 or more completed points in the database (i.e. all points that were not point penalties or missed points). Eighteen players fitted these criteria. Since the Match Charting Project is, unfortunately, a nonrandom sample of matches, I felt uncomfortable making assessments below a very large number of data points. Using 2000 or more data points, however, an overwhelming amount of data would be required to overcome these assessments, giving some confidence that, while bias exists, we get in the neighborhood of the true aggression values.
The Results
Below are the results from the analysis. Tables 1-3 provide the Aggression Scores for each player overall, broken down into serve and return scores and further broken down into first and second serves. They also provide differences between where we would expect the player to be more aggressive (Serve v. Return, First Serve v. Second Serve and Second Serve Return v. First Serve Return).
Table 1: Aggression Scores
Name         Overall  On Serve  On Return  S-R Spread
S Williams     0.281    0.3114     0.2476      0.0638
S Halep       0.1818    0.2058     0.1537      0.0521
M Sharapova   0.2421    0.2471     0.2358      0.0113
C Wozniacki   0.1526    0.1788     0.1185      0.0603
P Kvitova     0.3306     0.347      0.309       0.038
L Safarova    0.2475    0.2694     0.2182      0.0512
A Ivanovic    0.2413     0.247     0.2335      0.0135
Ka Pliskova    0.256    0.2898     0.2095      0.0803
G Muguruza     0.231     0.238     0.2214      0.0166
A Kerber      0.1766    0.2044     0.1433      0.0611
B Bencic      0.1742    0.1784     0.1687      0.0097
A Radwanska   0.1473    0.1688     0.1207      0.0481
S Errani      0.1232    0.1184     0.1297     -0.0113
E Svitolina   0.1654    0.1769     0.1511      0.0258
M Keys        0.3017    0.3284     0.2677      0.0607
V Azarenka    0.1892    0.1988     0.1762      0.0226
V Williams    0.2251     0.247     0.1944      0.0526
E Bouchard    0.2458    0.2695     0.2157      0.0538
WTA Tour       0.209    0.2254     0.1877      0.0377
Table 2: Serve Aggression Scores
Name          Serve  First Serve  Second Serve  1-2 Spread
S Williams   0.3114       0.3958        0.2048       0.191
S Halep      0.2058       0.2298        0.1587      0.0711
M Sharapova  0.2471       0.2715        0.1989      0.0726
C Wozniacki  0.1788       0.2016         0.121      0.0806
P Kvitova     0.347       0.3924        0.2705      0.1219
L Safarova   0.2694       0.3079        0.1983      0.1096
A Ivanovic    0.247       0.2961        0.1732      0.1229
Ka Pliskova  0.2898       0.3552        0.1985      0.1567
G Muguruza    0.238       0.2906        0.1676       0.123
A Kerber     0.2044       0.2337        0.1384      0.0953
B Bencic     0.1784       0.2118        0.1218        0.09
A Radwanska  0.1688       0.2083        0.0931      0.1152
S Errani     0.1184       0.1254        0.0819      0.0435
E Svitolina  0.1769       0.2196         0.105      0.1146
M Keys       0.3284       0.3958        0.2453      0.1505
V Azarenka   0.1988       0.2257        0.1347       0.091
V Williams    0.247       0.3033        0.1716      0.1317
E Bouchard   0.2695       0.3043        0.2162      0.0881
WTA Tour     0.2254       0.2578        0.1679      0.0899
Table 3: Return Aggression Scores
Name          Serve  1st Return  2nd Return  Spread
S Williams   0.2476      0.2108      0.3116  0.1008
S Halep      0.1537      0.1399      0.1778  0.0379
M Sharapova  0.2358      0.2133      0.2774  0.0641
C Wozniacki  0.1185      0.1098       0.132  0.0222
P Kvitova     0.309      0.2676      0.3803  0.1127
L Safarova   0.2182      0.1778      0.2725  0.0947
A Ivanovic   0.2335      0.1952      0.3027  0.1075
Ka Pliskova  0.2095      0.1731      0.2715  0.0984
G Muguruza   0.2214      0.1888      0.2855  0.0967
A Kerber     0.1433      0.1127       0.191  0.0783
B Bencic     0.1687      0.1514       0.197  0.0456
A Radwanska  0.1207      0.1049      0.1464  0.0415
S Errani     0.1297      0.1131      0.1613  0.0482
E Svitolina  0.1511      0.1175      0.1981  0.0806
M Keys       0.2677      0.2322      0.3464  0.1142
V Azarenka   0.1762      0.1499      0.2164  0.0665
V Williams   0.1944      0.1586       0.255  0.0964
E Bouchard   0.2157      0.1757      0.2837   0.108
WTA Tour     0.1877      0.1609      0.2341  0.0732
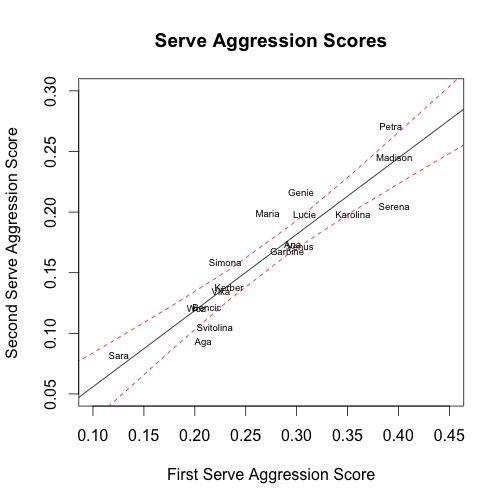
The first plot shows the relationship between serve and return aggression scores as well as the regression line with a confidence interval (note: since there are only 18 players in the sample, treat this regression line and all of the others in this post with caution).

The second and third plots show the relationships between players’ aggression scores on first serves and their aggression scores on second serves for serve and return points respectively as well as the regression lines with confidence intervals.

The fourth and fifth plots show the relationship between the spread of serve and return aggression scores between first and second serve and the more aggressive point for the player, i.e. first serve for service points and second serve for return points as well as the regression lines with confidence intervals.


We can take away five preliminary observations.
Sara Errani knows where her money is made. The WTA is notoriously terrible for providing statistics. However, they do provide leaderboards for particular statistics, including return points and games won. Errani leads the tour in both this year. She also uniquely holds a higher Aggression Score on return points than serve points. From this information, we can hypothesize that Errani may play more aggressive on return points because she has greater confidence she can win those points or because she relies on those points more to win.
Maria Sharapova is insensitive to context; Elina Svitolina is highly sensitive to context. She falls outside of the confidence interval in all five plots. More specifically, Sharapova consistently is more aggressive on return points, second serve service points and first serve return points than her scores for service points, first serve service points and second serve return points respectively would predict. She has also lower spreads on serve and return than her more aggressive points would predict.
This result suggests that Sharapova differentiates relatively little in how she approaches points according to whether she is serving or returning or whether it is first serve or second serve. Svitolina exhibits the opposite trend as Sharapova. Considering anecdotal thoughts from watching Sharapova and Svitolina, these results make sense. Sharapova’s serve does not seem to vary between first and second and we see a lot of double faults. Svitolina can vary between aggressive shot-making and big first serves and conservative play. Hot takes are not always wrong.
Lucie Safarova, meet Eugenie Bouchard; Ana Ivanovic, meet Garbine Muguruza. Looking at the plots, it is interesting to note how Safarova and Bouchard seem to follow each other across the various measures. The same is true for Ivanovic and Muguruza. A potential application of the aggression score is that it can point us to players that are comparable and may have similar results. Players with good results against Safarova and Ivanovic may have good results against Bouchard and Muguruza, two younger players whom they are much less likely to have played.
Serena Williams and Karolina Pliskova serve like Madison Keys and Petra Kvitova, but they are very different. Serena, Pliskova, Keys and Kvitova are all players that are known for their serves as their weapons. Serena and Pliskova have the third and fourth highest Aggression Scores respectively. However, they also have wide spreads on serve and return scores and they have much lower second serve service point scores than their first serve scores would predict, whereas Keys is about where the prediction places her and Kvitova is far more aggressive than her first serve points would predict.
While Serena is still a relatively aggressive returner, she rates lower on first serve return aggression than Maria Sharapova. Pliskova falls to the middle of the pack on return aggression. Kvitova and Keys, in contrast, are both very aggressive on return points. My hypothesis for the difference is that while Serena and Pliskova are aggressive players, their scores get inflated by using their first serve as a weapon and they are only somewhat more aggressive than the players that score below them. Kvitova and Keys, on the other had, are exceptionally aggressive players.
The WTA runs through Victoria Azarenka and Madison Keys. Oddly, the players who seemed to best capture the relationships between all of the aggression scores and spreads of aggression scores were Victoria Azarenka and Madison Keys. Neither strayed outside of the confidence interval and often ended up on the best-fit line from the regressions. They define average for the WTA top 20.
These thoughts are preliminary and any suggestions on how they could be used or improved would be helpful. I also must beseech you to help with the Match Charting Project to put more players over the 2,000 point mark and get more points for the players on this list to help their Aggression Scores a better part of reality.
Yes! This is more like it.
I’ve used essentially this metric to analyse matches in-play to try to get a feel for how aggressive/passive each player is being, and how successful they are with those strategies.
One problem with the match charting data (that I’ve pointed out in comments on this blog before) is that there are two types of unforced errors. There’s those ones where the player goes big for the line and just misses, and there’s the ones where they miss when not going for anything in particular. The match charting project doesn’t allow you to distinguish the two.
My proposal is to replace the W/FE/UE paradigm with one which allows you to accurately keep track of the metric in this article in real time. Basically, a player can end a point in one of three ways: win it with aggression, lose it with aggression, make a passive error. It’s pretty easy to keep track of this when watching a match live, but you have to bear in mind that aggression isn’t just the one shot – it can be a two or more shot sequence. E.g. a drop shot/lob combination is definitely an aggressive play – the player has committed to ending the point and is either going to win it or lose it.
Even better, this analysis allows you to see whether a player is playing the right strategy or not. If you watch a player like Camila Giorgi you see that she doesn’t hold back, she just keeps going for it even if she is making tons of errors. Given these numbers it’s a simple bit of maths to work out what %age of points a player should be trying to take the initiative. The answer is almost never all of them – someone really should tell her father-coach this.