Also: Australian Open coverage recap
Don’t let Daniil Medvedev’s near-miss in the Australian Open final fool you: Jannik Sinner is the best player in the world right now. Like Sunday’s championship match, it’s close–but it might not be close for long.
I wrote in December about what I called the “most exclusive clubs” in tennis. Since 1991, when the ATP began keeping these stats, Andre Agassi and Novak Djokovic have been the only two players to finish a season in the top three of both hold percentage and break percentage. (Agassi did it twice.) Well, in the last 52 weeks, Sinner ranks second in hold percentage behind Hubert Hurkacz, and he stands third in break percentage, trailing only Medvedev and Carlos Alcaraz. It’s not a calendar year so we can’t officially add him to the list, but he’s playing as well on both sides of the ball as anyone ever has, apart from two all-time greats.
Oh, and on hard courts, Sinner out-holds even Hurkacz. He gets broken less than anyone in the game, securing his serve 89.9% of the time.
But wait–it’s even better than that. Alex Gruskin pointed out that since Wimbledon, Sinner’s hold percentage is 91.1%, within shouting distance of John Isner’s career mark of 91.8%. Isner cracked the top ten by combining that monster serve with a return that only a mother could love. Sinner, on the other hand, pairs absolutely dominant serving with one of the best returns in the game. Ever wonder what would happen if Big John had an elite return? Now you know.
Starting the clock at Wimbledon might raise an eyebrow–is that just the line that spits out the most impressive number?–but it’s a sensible way to divide the data. In June, not long before the Championships, Sinner rolled out a new, simplified service motion. While the measurements of the new delivery are not overwhelming–one more mile per hour, four centimeters closer to the line, a 0.7 percentage-point increase in first serves in–the results have been devastating. His serve has always been good; perhaps a few minor tweaks were all it took to make it great.
Winning how?
First, a bit of a puzzle. In the last 52 weeks, Sinner ranks fifth on tour in serve points won, with 68.3%. (Why not first or second, in line with his hold percentage? We’ll come back to that.) Yet despite the Isner comparisons, he doesn’t get it done the easy way. He hits aces just 8.4% of the time. That’s equal to the average of the ATP top 50, and it’s fewer than Djokovic.
The answer doesn’t lie in unreturned serves, either. Some players do get more free points than their ace counts imply. Stefanos Tsitsipas, for instance, ranks well down the ace list, finishing just 9% of his serve points that way. But he looks much more elite when we measure how many don’t come back–almost one-third, in his case. Sinner’s 29.6% rate of unreturned serves is above average, but it’s hardly the stuff that record-breaking hold numbers are made of. The next man on the list, for comparison’s sake, is Frances Tiafoe.
What about plus-ones? Sinner serves big, but relatively speaking, his groundstrokes are even bigger. Can we explain his serve-game success by the rate at which he ends points with his second shot?
Still no! He wins 40% of his serve points by the third shot of the rally. Again, that’s a solid mark: Djokovic and Alcaraz are about the same. On the other hand, so is Jiri Lehecka, and Tiafoe is even better.
Once a point reaches the fourth or fifth shot–especially if it began with a second serve–winning it is more about contesting a rally than converting any lingering advantage of the serve. If the returner puts the fourth stroke of the point in play, he has a 52% chance of winning it. Big servers still get some easy putaways, but opportunities disappear as the rally develops. When that happens, winning service points relies on a different set of skills–assets that Sinner, unlike many a big server, amply possesses.
Sinner, then, has the whole package, even if no single one of his weapons stands out like the Isner serve. He serves big enough to clean up 40% of points with his first or second shot. It the point lasts longer, he has probably hung on to more of an advantage than most players do: His heavy, deep groundstrokes see to that. In a really long rally, okay, maybe the edge goes to Medvedev or Alcaraz, but who else is going to outlast the Italian?
Most players excel at some stage of service points, but not all. The following graph illustrates how service points typically develop, by showing the server’s chance of winning the point when each successive shot is put in play. Based on charted men’s matches since 2021, servers win 64.2% of points. That goes up to 66.5% if they land a serve; it goes down to 52.5% if the return comes back. Several strokes later the server’s advantage is mostly gone: If he puts the 7th shot of the point in play, his chances of winning are 57.4%; if the returner comes back with an 8th shot, the server’s odds are down to 45%.
I’ve shown that progression along with specific numbers for Hurkacz, in order to demonstrate how these things go with our usual image of a big server:
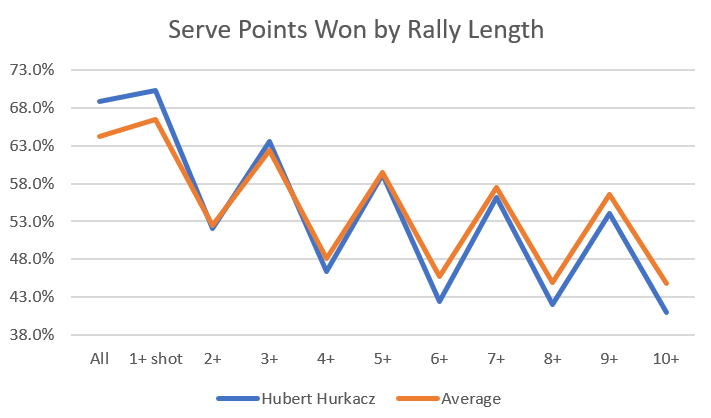
While the differences between Hurkacz and tour average are modest, you get the idea. Early in the point, a big server cleans up; the longer the rally goes, the further his results fall below the line.
Now, the same graph with Sinner’s results from 2021 to the present:
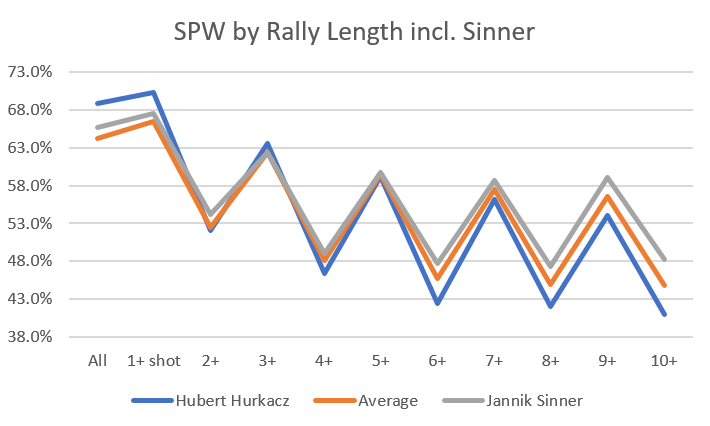
He doesn’t start as high as Hurkacz, but he does do a little better than average. Crucially, he never falls below the average line, and the longer the point extends, the more he surpasses it.
I hope you’ve stuck with me this far, because the payoff is worth it. Same graph, only instead of Sinner’s three-plus-year average, we have his numbers since the beginning of 2023:
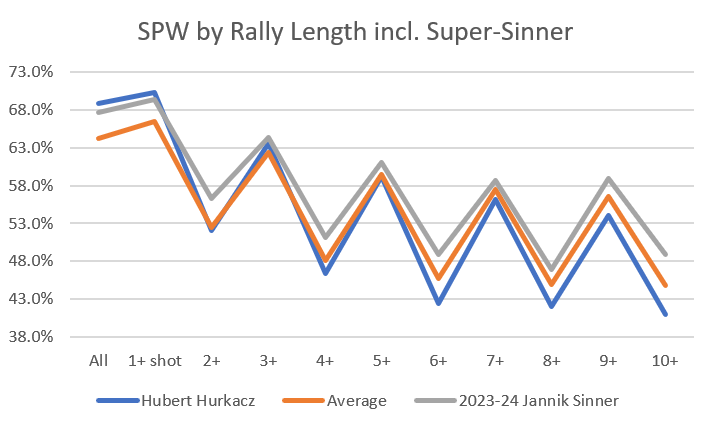
At the beginning of the point, Sinner is almost equal to Hurkacz. From then on, he takes over. A surprising gap comes early, at the two-plus rally mark, indicating that he doesn’t make many mistakes with his plus-one shot, even if he doesn’t put away an overwhelming number of them. No matter how long the point continues, the Italian outperforms tour average for that particular situation.
In tennis, it’s almost impossible to be good at everything. You can put together a nice, quite lucrative career by merely getting close to average in most categories and having one or two standout weapons. Sinner, we’re beginning to see, is not just good at everything, he is verging on great.
Break points
We now know why Sinner is winning so many serve points. But I mentioned another mystery we have yet to resolve. The Italian ranks fifth in the last 52 weeks in serve points won, the middle of a tightly-packed trio with Nicolas Jarry and Taylor Fritz, about one percentage point behind Hurkacz, Tsitsipas, and Djokovic. Yet he challenges Hurkacz for the top spot in the closely related, more consequential category of hold percentage:
Player               Hld% Rk   Hld%  SPW Rk   SPW%
Hubert Hurkacz             1  89.1%       1  69.6%
Jannik Sinner              2  88.8%       5  68.3%
Stefanos Tsitsipas         3  88.4%       2  69.5%
Novak Djokovic             4  87.6%       3  69.4%
Nicolas Jarry              5  87.1%       4  68.4%
Alexander Zverev           6  86.1%       7  67.4%
Taylor Fritz               7  86.0%       6  68.2%
Christopher Eubanks        8  85.8%       8  67.1%
Carlos Alcaraz             9  85.7%      10  67.0%
Tallon Griekspoor         10  85.1%      12  66.7%
The lists are almost identical, except for Sinner’s placement. He wins points at almost the same rate as Jarry and Fritz, yet he holds serve more often than either one.
As mysteries go, this isn’t a tough one. Not all points are created equal; if you win more of the important ones, you’ll outperform the players who don’t. Nobody knows that better than Sinner, who upset Djokovic in Turin despite winning exactly the same number of points, then beat him again at the Davis Cup with just 89 points to Novak’s 93. He out-pointed Medvedev yesterday 142 to 141.
Sinner wins these matches by saving break points at a remarkable clip. While winning 68.3% of serve points overall, he has held off 71.7% of break chances, including 36 of 40 in Melbourne. No one else on tour tops 69%, and Hurkacz comes in at 65%. On average, top-50 men save break points two percentage points less than they win typical serve points (63.5% to 65.5%), mostly because stronger returners generate more break points.
The question, then, is whether this is sustainable. ATP numbers indicate that Sinner goes bigger on break points, averaging 125 mile-per-hour first serves in those situations rather than his usual 122s. It seems to be working, but it can’t be that straightforward. Surely he isn’t the first player to arrive at the strategy of simply hitting harder, and besides, that usually comes at a cost. Will he continue to land enough of those bigger first serves to justify the payoff?
I can’t answer that question, but I can tell you what usually happens after a season of break-point overperformance: It doesn’t last. Taking over 2,600 player-seasons since 1991, 582 (21.7%) of players saved more break points than they won serve points overall. 183 (6.8%) matched Sinner’s mark of saving at least two percentage points more than their serve-points-won rate.
Of those 183, just eleven repeated the feat the following year. None of them were big servers, and nobody managed it three years in a row. The average following-year performance of the 183 men was 1.5 percentage points fewer break points saved than their rate of serve points won–just a tick better than tour average.
Unless Sinner has developed a new secret sauce–to be clear, with Darren Cahill in his corner, I’m not ruling it out!–that’s probably the fate that awaits him. In more than three decades, only 23 men have saved at least 71.7% of the break points they faced for a full season. The Italian probably won’t keep that up, and his out-of-this-world hold percentage will fall to something more plausible, in the 86-87% range.
Fortunately, that’s still exceptionally good. The 22-year-old serves like Jarry or Fritz while racking up as many return points as Djokovic. Take away the break point magic and you still have a contender for every slam. Sinner continues to lurk in fourth place in the official ATP rankings, but as of today, he is number one on the Elo list. Before long, those positions will converge, and it won’t be because his Elo rating goes back down.
* * *
AO recap
I hope you’ve enjoyed my coverage throughout the Australian Open. I’ll continue to write this sort of thing throughout the year, though not always every weekday!
In case you missed it, here are the ten other articles posted since the action in Melbourne began:
- The Improbable Rise of Emma Navarro
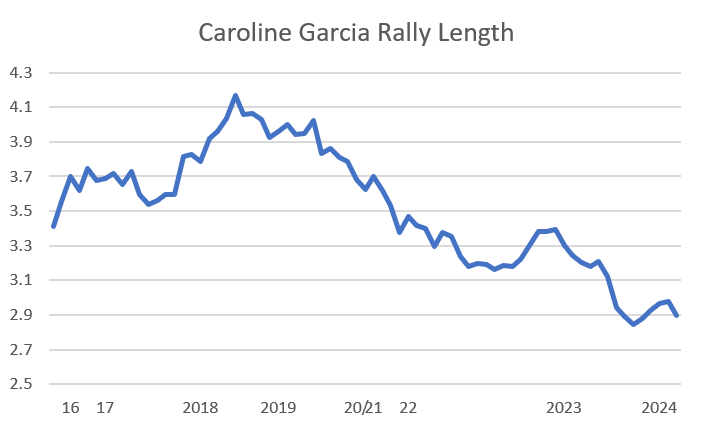
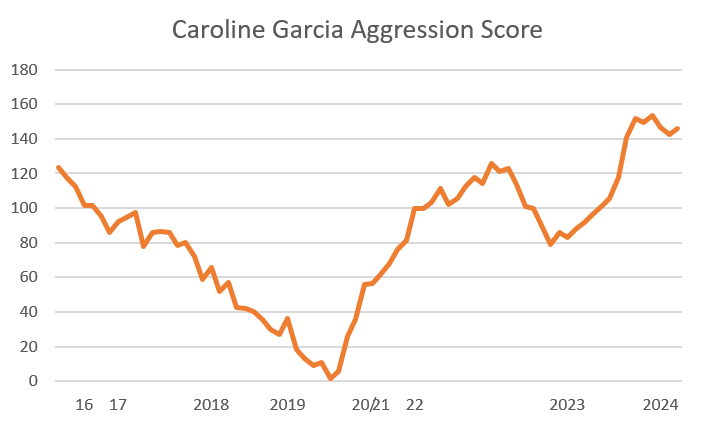
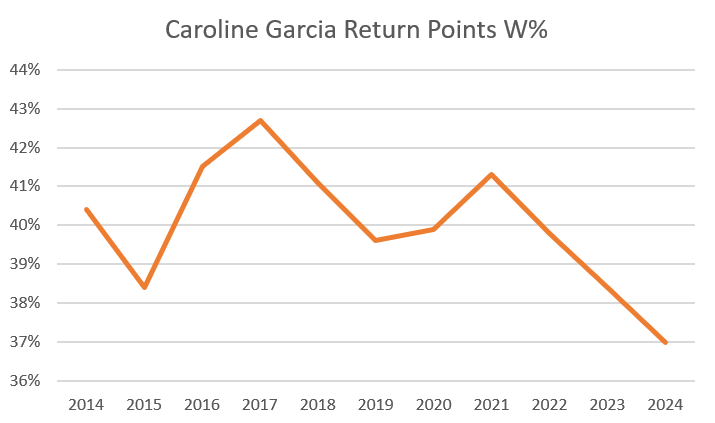
- The Manufactured Attack of Caroline Garcia
- Can Lorenzo Sonego Hunt Down Enough Forehands?
- Jiri Lehecka’s Excess of Self-Restraint
- Qinwen Zheng’s Serve Under Construction
- Andrey Rublev, Grand Slam Quarter-finalist (plus some considerations about Sinner’s Elo rating)
- Anna Kalinskaya At Her Peak
- How Coco Gauff Escaped a Trap of Her Own Making (plus stats on Sinner’s break points saved)
- How To Play One-Set Shootouts Like Daniil Medvedev
- Aryna Sabalenka Under Pressure
Thank you for reading.
* * *
Subscribe to the blog to receive each new post by email:
.jpg)
_05.jpg)
.jpg)
_(53032186896).jpg)
_09.jpg)
.jpg)