The Match Charting Project keeps growing, and starting today, even more of the data is available for anyone who wants it. Several new contributors have helped us pass the 750-match milestone, having added an average of two matches per day since I first published the raw data.
New spreadsheet
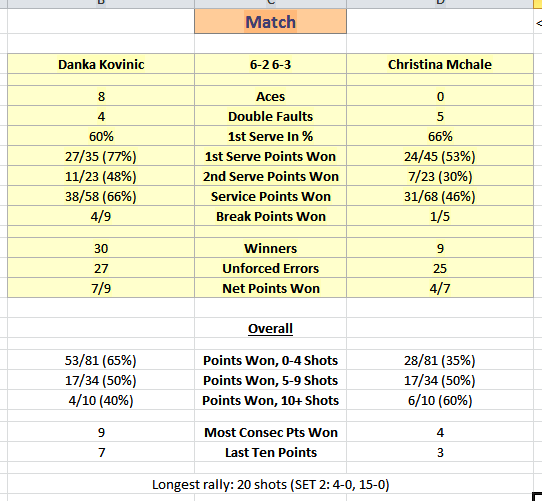
The Match Charting spreadsheet now does a lot more. As you chart each point, the document updates stats for the match–both total and set-by-set. You’ll find the same stats you see on television (aces, double faults, winners, unforced errors, etc) along with some that are a little less common, like winning percentage in different lengths of rallies, and most consecutive points won.
In other words, As you chart the match, you’ll have access to many of the same stats that commentators do. Here’s what it looks like:
If you’ve hesitated to try charting because you couldn’t see what was in it for you, I hope this changes the calculation a bit.
Click here to download the MatchChart template.
New data
About a month ago, I published the point-by-point data from all charted matches. In raw form, it’s a bit daunting, and it’s more than what’s necessary for many interesting research projects.
Today, I added 15 different aggregate stats files for men, and another 15 for women. These contain the data that is shown in each charted match report. For instance, if you find it interesting that Simona Halep hit 14% of her backhands down the line in the Indian Wells final, you can take a look in the ShotDirection stats file and compare that number with the results from Halep’s other charted matches, or all matches in the database as a whole.
You can find these files (along with the updated raw data for 760+ matches) by clicking here.
Chart some matches
If you haven’t already, now is a great time to start charting professional matches and contributing to the project. An enormous number of matches are televised and streamed, and as the database of charted matches grows, there’s more and more useful context to all the data we’re generating.
You can start by jumping into the ‘Instructions’ tab of the new MatchChart spreadsheet, or for other tips, you can start with my blog post introducing the project.
Hi there, thanks for producing a new spreadsheet. I am just wondering where can I see the replay for most of the ATP Tour matches, do you have some links?