Predicting Next Year’s Elo Ratings

I often illustrate the difference between Elo ratings and the traditional ATP and WTA ranking-point systems as follows: The official rankings tell you how good a player was six months ago. Elo estimates where they are today. For the purposes of tournament entry and so on, a 52-week average makes sense. But if you’re predicting the outcome of tomorrow’s match, you don’t want to assign the same weight to a year-old result that you give to yesterday’s news.

That said, Elo ratings are not explicitly predictive. They rely only on past results. They don’t recognize the fact that a player on a hot streak will probably cool off, or that a younger player is more likely to improve than an older one. If we want to look further ahead than tomorrow’s match, we need to take some of those additional factors into account.

Hence today’s project: Projecting Elo ratings one year in advance. Elo ratings tend to be a leading indicator of official rankings, so if we can get some idea of a player’s future in Elo terms, we can estimate–very approximately, I admit–his or her ATP or WTA ranking even further out.

I kept things simple. Each player’s forecast is based on four variables: Age, current Elo rating, rating one year ago, and rating two years ago. Current rating is by far the most important consideration. It accounts for over 70% of the men’s forecast and 80% of the women’s. Everything else is essentially a tweak. The two older ratings allow the forecast to make adjustments if the current rating is an outlier. By including player age, we account for the fact that players over 25 or 26 start–on average!–to decline, and the older they are, the sharper the decline.

Take Novak Djokovic as an example. His current Elo rating is 2,227, one year ago it was 2,145, and two years ago it was 2,186. Because his 2023 year-end rating was higher than 2021 or 2022, we’d expect a small step backwards. And because he’s 36 years old, the laws of physics might eventually slow him down. Put it all together, and the model projects his 2024 year-end Elo at 2,116. Excellent, but slightly more human, and a number that would’ve placed him third on this year’s list.

Here is what the model predicts as the 2024 year-end top ten:

Rank  Player              2024 Elo  2023 Rank  2023 Elo  
1     Jannik Sinner           2144          2      2197  
2     Carlos Alcaraz          2137          3      2149  
3     Novak Djokovic          2116          1      2227  
4     Daniil Medvedev         2059          4      2104  
5     Alexander Zverev        2021          5      2024  
6     Andrey Rublev           1988          6      2020  
7     Stefanos Tsitsipas      1969          9      1974  
8     Holger Rune             1954         12      1936  
9     Hubert Hurkacz          1950          8      1983  
10    Grigor Dimitrov         1928          7      2011

As precise as that table looks, it is hard to predict the future. Here are the same ten players, with a 95% prediction interval shown:

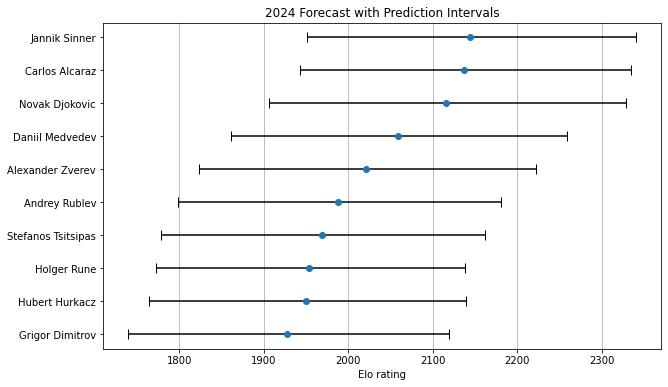
The intervals demonstrate just how uncertain we are, with 12 months of tennis to play. If Jannik Sinner or Carlos Alcaraz hits the high end of his range, in the mid-2,300s, he’ll have established himself as a runaway number one. But if they surprise in the other direction, they’ll land below 2,000 and just barely stay in the top ten. Even these intervals don’t quite account for all the unknowns. There’s a nonzero chance that any of these guys will get hurt and miss most of the season, leaving them off the 2024 year-end list entirely.

I suspect, also, that a more sophisticated model would give a different range of outcomes for Djokovic. There are few precedents for his level of play at age 36, and he outperformed expectations in 2023. Had we run this model a year ago, it would’ve predicted a 2,071 Elo for him now. He beat that by more than 150 points, landing around the 85th percentile of the projection. But time is cruel. Since 1980, five out of six 36-year-olds have seen their Elo decline from the previous season. The average year-over-year change–including those few players who gained–is a loss of 45 points. It’s hard to bet against Djokovic, but at this point in his career, his downside almost certainly exceeds his upside.

Finally, let’s take a look at the projected 2024 top ten on the women’s side. It’s not nearly as juicy as the men’s forecast, as it barely differs from the 2023 list. As I mentioned above, a player’s current rating is a bigger factor in the forecast than it is for men–age is less of a factor, and if a player’s rating jumps around from year to year, women are more likely to stay at their current level than bounce back to a previous one. The forecast:

Rank  Player               2024 Elo  2023 Rank  2023 Elo  
1     Iga Swiatek              2197          1      2237  
2     Cori Gauff               2100          2      2127  
3     Aryna Sabalenka          2062          3      2099  
4     Jessica Pegula           2035          4      2089  
5     Elena Rybakina           2024          5      2059  
6     Marketa Vondrousova      1977          8      2005  
7     Ons Jabeur               1976          7      2007  
8     Karolina Muchova         1965          6      2014  
9     Qinwen Zheng             1961          9      2000  
10    Liudmila Samsonova       1938         11      1959

You might have noticed in both the ATP and WTA lists that most ratings–at least for top-tenners–are projected to go down. There’s a small regression component in the model, meaning that every player is expected to pull a bit back toward the middle of the pack. That doesn’t mean they will, of course, but on average, that’s what happens.

Here are the prediction intervals for the women’s top ten:

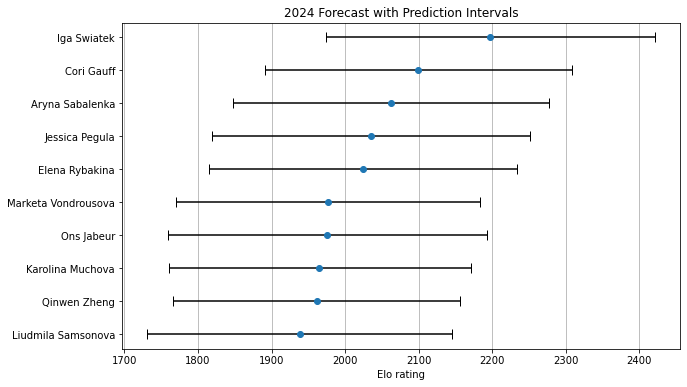
The magnitude of the intervals is about the same as it was for the men. Iga Swiatek could launch into a peak-Serena-like stratosphere, or she could, conceivably, land at the fringes of the top ten. Liudmila Samsonova, bringing up the end of this list, might challenge for a place in the top three, or she could be scrambling to stay in the top 50.

One thing is certain: The 2024 year-end lists won’t actually look like this. The value of this sort of forecast, even when it is so approximate, lies in the context it gives us. A year from now, we’ll be talking about which players outperformed or underperformed their expectations. Projections like these help us pin down what, exactly, was a reasonable expectation in the first place.

* * *

I’ll be writing more about analytics and present-day tennis in 2024. Subscribe to the blog to receive each new post by email:


The Purpose of Elo Ratings

The Tennis 128 will return tomorrow with player #126.

* * *

The good news: Elo ratings for tennis are popping up in more and more places, exposing an increasing number of fans to an alternate (and superior) system for ranking tennis players.

The bad news: A lot of people don’t yet understand how Elo ratings differ from the traditional points-based rankings. Many newcomers criticize either specific ratings or the system as a whole, often because they expect Elo to be just like the official rankings, only with slight tweaks to better match their own beliefs.

The purpose in one sentence: Elo ratings are designed to estimate each player’s ability level right now.

That’s it. The ATP and WTA systems are a hodge-podge of arbitrary decisions meant to balance results, willingness to play lots of tournaments, and performance in the latter stages of particular events. That doesn’t mean they are wrong–there’s often not much difference between the official rankings and the Elo list. You can devise an awful lot of methods for ranking women tennis players right now, and almost all of them will put Ashleigh Barty at the top of the list.

When the results do differ, it’s important to remember what the official rankings prioritize. In the rankings released today, Naomi Osaka is 85th on the WTA computer, against 12th in my Elo ratings. Despite the enormous gap, in a way, they’re both right. Osaka has played only seven events since last year’s Australian Open, so the WTA method treats her as a part-timer with a handful of decent results. Elo, on the other hand, recognizes that she won two of the last six grand slams. It rates her lower than it did a year ago, but Elo doesn’t simply forget about extremes of form because a magic 52-week window expires.

If you’re interested in what a player deserves (whatever that means), the ATP and WTA formulae are probably what you’re looking for. You may have some quibbles with the system, but everybody knows (approximately) how it works. If a player wants to crack the top ten, she understands what she needs to do, and at which events, to accomplish that.

If you’re interested in who will win tomorrow, Elo is almost always your better bet. The official rankings don’t even try to estimate a player’s current level. By definition, they serve as the average of a player’s performances over the last 52 weeks (unless a pandemic changes the rules), so the ranking is a decent approximation of their level five or six months ago. Osaka may not “deserve” a spot in the top 80, but most of us would be ecstatic to make an even money bet that she would beat #84 Anna Bondar or #86 Xinyu Wang. Elo’s estimate of #12 suggests a much more plausible range for how well she will play the next time she steps on court.

Just as the official rankings don’t try to estimate a player’s current form, Elo doesn’t concern itself with what players “deserve.” You might think that Gael Monfils has earned his spot in the top 20–after all, he won a tournament to start the year and followed it up with a run to the Australian Open quarter-finals. Elo had him several places lower, even before his opening-match loss to Mikael Ymer last week. Now he sits at #32. A major quarter-final is a nice achievement, but Elo recognizes that Monfils’s eight wins in Adelaide and Melbourne were against mediocre competition, including several players who were playing on their weaker surface.

Personally, I don’t care much about what players “deserve” from a system that–while adequate and widely accepted–is slapped together and incoherent. I’m more interested in who’s playing the best tennis, so Elo is exactly what I want to see. But that doesn’t mean you have to feel the same way. If you want your rankings to measure something else, that’s fine. Just don’t get mad at Elo.

20 > 21 > 20

Rafael Nadal has finally nosed his way into the lead. With his Australian Open title yesterday, he became the first man to 21 major singles titles, breaking away from the three-way tie at 20 with Novak Djokovic and Roger Federer.

For some people, leading the all-time grand slam race is enough to cement a player as the greatest of all time. A different crowd considers this year’s Australian Open tainted because Djokovic was not allowed to play. Still others think that Federer played some beautiful tennis, and they considered the matter concluded at least five years ago.

I belong to a fourth camp, which I can summarize with two positions:

  1. The grand slam race isn’t everything.
  2. If you do focus on grand slams, you must adjust the major count for the quality of opponents each player faced.

I’ve written about this before, first at The Economist, and then here at the blog. When I checked in 18 months ago, Nadal’s 20 majors were worth a bit more than Djokovic’s 17, which were themselves more impressive than Federer’s 20. The margins have always been slim between these three, and properly adjusting for quality of opponents makes things even tighter.

The update

Here’s how the adjustment works. For each slam that a player won, we take the Elo rating of all of his opponents, and work out the probability that the average Open Era grand slam winner would beat all of them. Once we have that number–which centers around 23%–we normalize it so that the value of an “average” major is 1.0.

When a major title requires facing down a lot of tough opponents, its rating is higher than 1.0, while a relatively easy one rates below 1.0. In the last few years, the numbers have drifted downward, because while the familiar names keep winning quite a bit, they haven’t needed to face each other as often as they used to.

You might disagree with the methodology, and that’s fine. But I find that most people end up making some sorts of adjustments, even if they shy away from stats or only tweak the totals when it favors their idol. Some Djokovic fans want to downplay Nadal’s recent win, and it’s true that Novak’s absence lowered the quality of the draw. But surely Rafa’s title isn’t worth zero. He beat many excellent players, and there was no guarantee that Novak would advance through the draw–or that Rafa would lose if they met.

This approach allows us to avoid specific minefields and answer all the analogous questions about every slam. Considering the seven opponents that Nadal faced, his Melbourne title rates at 0.84, weaker than average, but more difficult than seven of his prior titles. Djokovic has not enjoyed as many “easy” paths to major titles, but his Wimbledon victory last summer rates at a mere 0.60, the second-weakest of his career and lower than all but one of Rafa’s. Sometimes players just get lucky, with or without a geopolitical brouhaha.

Nadal’s 21st title rates only a bit lower than Djokovic’s two other titles last year: 0.90 at the Australian and 0.93 at the French.

Here are the updated rankings for “adjusted slams,” along with a table showing how many easy, medium, and hard paths that the Big Three have endured:

Player    Slams  Avg Score  Total  
Nadal        21       0.95   19.9  
Djokovic     20       1.01   20.1  
Federer      20       0.89   17.9  
                                   
Player     Easy     Medium   Hard  
Nadal         8          8      5  
Djokovic      6          7      7  
Federer       9         10      1

As if 21 and 20 weren’t close enough, this approach gives Djokovic 20.1 adjusted slams to Nadal’s 19.9. Again, you don’t have to agree with every step of my approach here to accept that we often think in terms of these kind of adjustments, and that Djokovic has–on average–faced tougher roads to titles than Nadal, while Federer had it easier than both of them.

Players can’t control who they face, but as fans, we can appreciate who worked the hardest to achieve near-equivalent feats. Fingers crossed that both Novak and Rafa excel at Roland Garros, so they can fight it out on the court, not in some random guy’s spreadsheets.

Aslan Karatsev Isn’t Better Than Novak Djokovic, But…

What’s better, winning 15 of 17 matches, or going undefeated for 9?

Even if you know that the 15-2 guy is Aslan Karatsev in 2021, and the 9-0 guy is Novak Djokovic this year, there’s no obvious answer. Sure, Djokovic beat Karatsev easily, and Novak’s nine wins included a grand slam title. We know Djokovic is the better player–he’s got more than a decade of proof to support that claim–and no one in their right mind would take Karatsev’s last three months over Novak’s.

True as all of that is, it’s not the question I’m asking.

The player with the 15-2 record has two advantages over his 9-0 peer. First, he has more wins. (Mind-blowing stuff, I know.) Second and more importantly, he has more evidence of his current level, even if it includes two losses. The 9-0 guy could go undefeated for 17 matches… but he could also end up 11-6. His nine-match record simply doesn’t give us as much information.

Again, if you know which players I’m talking about, that doesn’t matter–we have 1,100 matches worth of information about Djokovic, most of which say that his 9-0 is business as usual. He might not win his next eight matches, but he’s certainly not going to lose more than a few of them.

The yElo light at the end of the tunnel

If you’ve been reading my last couple of posts, you know where I’m going with this.

Last week, I introduced the concept of yElo. The “y” stands for year, but it can be used for any unit of time shorter than an entire career. Instead of using every bit of available information, we look only at a designated time frame, such as the 2021 season. While maintaining our knowledge of other players (e.g. Andrey Rublev is a really tough opponent; Egor Gerasimov not so much), we treat each player as if we know nothing else about him.

So truly, we’re comparing Karatsev’s 15-2 with Djokovic’s 9-0, taking into account the quality of their competition.

Plug every ATPer’s 2021 season into the formula, and here are the yElo leaders, through last weekend’s finals in Dubai and Acapulco:

Rank  Player                  W-L  yElo  
1     Aslan Karatsev         15-2  2082  
2     Novak Djokovic          9-0  2081  
3     Daniil Medvedev        13-2  2061  
4     Andrey Rublev          15-3  2006  
5     Marton Fucsovics       14-4  2000  
6     Stefanos Tsitsipas     14-4  1983  
7     Alexander Zverev        9-4  1922  
8     Matteo Berrettini       8-2  1918  
9     Jeremy Chardy          13-6  1915  
10    Lloyd Harris           11-5  1878  
11    Jannik Sinner           9-4  1848  
12    Alexei Popyrin          9-3  1836  
13    Roberto Bautista Agut   8-7  1831  
14    Taylor Fritz            7-4  1830  
15    Sebastian Baez         14-1  1820  
16    Felix Auger Aliassime   8-4  1818  
17    Karen Khachanov         9-5  1810  
18    Mackenzie McDonald     11-5  1809  
19    Tomas Machac           10-3  1806  
20    Daniel Evans            6-3  1800

Yes, Karatsev really does outscore Djokovic. Barely.

We are accustomed to 52-week rankings and Elo ratings that carefully weigh an entire career’s worth of work. So this is a deeply weird list, with only a handful of players anywhere near where we’d expect. #15 and #19 are Challenger-level guys, for crying out loud!

Embrace the race

The official Race to Turin doesn’t look as bizarre as the yElo list, but imagine showing it to someone in December, with Karatsev 5th, Marton Fucsovics 7th, and Rafael Nadal outside the top 20. Both the Race and the yElo list are “wrong” in the traditional sense, but they tell us much more about the 2021 season than the old-fashioned rankings do.

Tennis’s relentless focus on the long view sucks some excitement out of the season. Think of virtually any team sport. A month into the season, some unheralded club has gotten off to a hot start, and at least in some quarters, that’s the story–can they keep it up? should we have seen this coming all along? Nobodies are cast in the role of front-runners, and established stars play the part of underdogs.

In tennis, nobodies are… well, nobodies who won a few matches lately. Superstars play the part of superstars who’ve been taking some time off. Sure, we know that Djokovic and Nadal are going to end up near the top of the rankings list in November, just like we know the Dodgers and Yankees will be in the playoffs. But that doesn’t mean we ought to take it as a foregone conclusion from day one. In baseball, as the saying goes, everybody’s in first place on Opening Day.

Embracing the race–focusing on which players are leading the pack at each point throughout the season–doesn’t have to mean throwing away longer-term rankings. The traditional calculations should still be used for tournament entries and (maybe) for seedings. Top players have earned as much, and tournament entry is a factor that isn’t present in the major team sports.

Everybody wants to know how the ATP will survive when the Big Three are out of the picture. Well, this is a start–pay attention to who’s winning in 2021. If we take yElo’s word for it, a virtual nobody emerged to overtake Djokovic for the #1 spot going into Miami! An Argentinian prospect is playing like a top-15 guy just by winning a bunch of Challengers! Jeremy Chardy is more than just a hitting partner for the other Frenchmen!

The stories are out there, just like they are every year. It’s a shame that they get buried by all the talk about players who won last year.

I’ve added men’s and women’s yElo ratings to the Tennis Abstract website, and they’ll be updated weekly.

The Best 22-Match yElo Streaks

Earlier this week I wrote about Garbine Muguruza’s outstanding start to the season, and I introduced a new method to quantify a player’s level in a relatively short time span. Instead of using traditional Elo, which takes into account everything we know about a player, my new metric, yElo, uses what we know about everyone else, but treats a player’s short-term performance as if it is all we know about her. The parameters for yElo, such as k-value, are the same as the ones I’ve arrived at to make “regular Elo” as predictive as possible.

In other words, we measure Muguruza’s 22 matches in 2021 as if she had never played a WTA event before. As we saw in my earlier post, this approach considers the strength of opponents each player faced, and it rates her 18-4 record as better than anyone else in 2021, including Naomi Osaka’s 10-0 start.*

* excluding walkovers, which I ignore for all versions of Elo and yElo.

Muguruza’s season start has been outstanding and it is definitely underrated by the official WTA rankings and maybe even by the race, but I don’t want to make too much of it–one title in five tournaments in hardly world-historical stuff. On the other hand, it’s a good way to get our feet wet with a new metric that I think will prove useful for a wide range of tennis comparisons.

Garbine vs Garbine

The Spaniard won majors in 2016 and 2017, and she briefly reached number one in the rankings in September of 2017. Those achievements belong on a Hall of Fame plaque over her recent Dubai title and Yarra River Classic final. But was she really playing better back then?

She was not! I ran the yElo formula for every 22-match sequence in Muguruza’s career. The best of the bunch–again, taken entirely out of context, as if we know nothing beyond those 22 matches–was a run late in 2015 when she reached the Wuhan final, won Beijing, then went undefeated in the WTA Finals round robin stage. Her yElo based on those 22 matches was 2172, narrowly better than her 2021 yElo of 2160.

The more memorable moments of her career don’t quite stack up:

Elo   W-L   Span                            
2172  17-5  2015 Wim R16 - WTA Finals RR    
2160  18-4  2021 Abu Dhabi R64 - Dubai F    
2148  18-4  2017 Birmingham R32 - Cinci F   
2122  19-3  2017 Wimb R128 - USO R16 (#1)   
2084  17-5  2017 Miami R64 - Wimb F         
2076  16-6  2016 Doha QF - Roland Garros F 

I haven’t shown every 22-match sequence of her career, because that list is long and boring–the streaks heavily overlap with each other, and thus there are often tiny differences between them. But it is instructive to look at the time periods that ended at key moments.

The best of that bunch was the 22-match run ending with Muguruza’s 6-1 6-0 beatdown of Simona Halep at the 2017 Cincinnati final. That set the stage for her ascent to #1, though the ranking move didn’t happen until after the US Open. That streak is close to her current level. The 22 matches leading up to the official #1 takeover are a bit lower (she lost to Petra Kvitova at the US Open, which was less forgivable then than now), and the timespans ending with her two slam finals are still further down the list.

Don’t misunderstand–Muguruza was playing very well throughout all of these time periods. But when we crunch the numbers, we find that her current level is roughly on par with the best she’s ever played.

Garbine vs the world

Metrics are a lot more informative once we gain some context. Many of you probably have a good sense of what regular Elo ratings mean–2100+ is outstanding, 2000+ is top ten-ish, 1900+ is approximately the top 20, and so on. We can piggyback on that for yElo. When Muguruza’s 22-match yElo this season is 2160, it really does mean that, when feeding that very limited set of results into the Elo formula, it thinks Muguruza’s level is close to that of the best player in the world.

Well… the best player in the world right now. There’s no truly dominant force in women’s tennis at the moment, so we’re not seeing players at the top end of the all-time Elo scale. In regular Elo, peak Martina Navratilova and peak Steffi Graf topped 2600, more than 400 points above Osaka’s current rating of 2189. It will not surprise you, then, to learn that Navratilova, Graf, Serena Williams, Chris Evert, and many others put together 22-match runs* that make Muguruza’s 2021 season look positively pedestrian.

* yes, I know how ridiculous it is that this whole article is based on the arbitrary 22-match time span. We could do the same stuff with the more natural-sounding 20-match span, but there wouldn’t be an intuitive way to fit Muguruza’s current run into the discussion. And let’s face it, 20 is just as arbitrary as 22.

Out of my entire database on women’s tennis results going back to 1950 or so, about 100 women have enjoyed a 22-match run that outscores Muguruza’s best. The top of the list is the end of Navratilova’s 1983 season, which is worth a yElo of 2445. Close behind is Monica Seles, who reached 2438 with a streak starting at the end of 1992 and extending into the 1993 season. Three more women topped 2400, another 27 exceeded 2300, and 46 more put together 22 consecutive matches worth at least 2200.

Here are the 15 active women who’ve played at least as well as Muguruza for their best 22-match spans:

yElo  Player                W-L   Year(s)  
2389  Serena Williams       21-1  2001-02  
2386  Venus Williams        22-0  2000     
2335  Kim Clijsters         20-2  2002-03  
2332  Victoria Azarenka     22-0  2012     
2234  Vera Zvonareva        18-4  2008     
2217  Svetlana Kuznetsova   19-3  2004     
2217  Naomi Osaka           20-2  2019-20  
2209  Samantha Stosur       20-2  2010     
2205  Petra Kvitova         19-3  2011-12  
2205  Simona Halep          20-2  2018     
2196  Caroline Garcia       18-4  2017     
2186  Ashleigh Barty        19-3  2019     
2180  Angelique Kerber      18-4  2015-16  
2174  Carla Suarez Navarro  18-4  2015     
2172  Garbine Muguruza      17-5  2015

With the caveat that I haven’t spent much of my life thinking about the best 22-match runs in women’s tennis history, this seems like a credible list. I particularly like how yElo manages to consider strength of opponent to the point that an 18-4 run*, like Zvonareva’s in 2008, can outrank so many 20-2s. (Vera even beats a few 22-0s from the amateur era.)

* the link shows a few extra matches–the 18-4 run starts in the QFs of Guangzhou and ends in the Tour Finals semi-final. Note again that yElo skips retirements.

I hope you find the new yElo metric as interesting as I do. I’ll definitely be doing more with it, since I suspect it has value even outside the narrow context of one player and a single timespan of arbitrary lenth.

Repurposing Elo for Streaks, Seasons, and Garbine Muguruza

Elo is a fantastic tool for its explicit purpose: estimating the skill level of players based on available information. For instance, my WTA ratings currently rank Ashleigh Barty second. That seems plausible enough–it may be correct to give her the edge in a head-to-head matchup with everyone on tour except for Naomi Osaka. But with women pursuing such different schedules this season, a rating is only so useful.

For all of Barty’s or Osaka’s skill, is it right to say either one of them has had a better 2021 season than Garbine Muguruza? Osaka won the Australian Open, so she has a valid claim. Barty’s argument is a lot more tenuous, based on only eight victories. The Spaniard’s case writes itself–only a handful of players are up to double digits in wins this year, and Muguruza already has 18. How could we decide? If Elo is the smart version of the official rankings, what’s the smart version of the official race?

Starting fresh

The Elo algorithm itself offers a solution. A big part of the reason Muguruza is rated 4th on my current Elo list–and not higher–is her career before 2021. We had hundreds of matches worth of data on Garbine before January 1st, and it would be silly to throw all that away. Her 18-4 start is fantastic, but it doesn’t supersede everything that came before. It just gives us reason to update our rating.

Here’s where the ranking/race analogy is useful. The official rankings use a time span of 52 weeks (or more). The race restarts on January 1st. We could do the exact same thing with Elo, throwing away all results from the previous year and starting over, but that would be wasteful–it wouldn’t allow us to take into account whether players had faced particularly easy or tough draws, for instance.

The solution is to set Elo ratings back to zero (or 1500, in Elo parlance) one player at a time.

Take Muguruza. Instead of starting the year with a rating of 1981 and a history of several hundred matches, we pretend to know nothing about her. We give her a newbie’s rating of 1500 and a history of zero matches. Then we run the Elo algorithm to update her rating over the course of her 22 matches. First she faces Kristina Mladenovic (with her actual rating at the time of 1817), and improves to 1605. Then she beats Aliaksandra Sasnovich (and her rating of 1805), and improves to 1692. Repeat for each of her 2021 results, and the end result is a rating of 2160–almost 100 points higher than her current “real Elo” rating and within shouting distance of Osaka’s 2189.

To compare players, work through the same steps for everybody else, calculating their current-season rating as if they played their first career match in January.

It’s worth taking a moment to think about exactly what we’re measuring. That outstanding 2160 rating is what you get if a complete unknown shows up with zero match experience, then goes on the 22-match run that has been Muguruza’s season so far. The difference between real-Garbine and fake-newbie-Garbine is that the real one has an extensive track record that tells us she’s always been good–but that she probably isn’t quite this good.

I call it … yElo

This approach is “Elo for seasons” or “year Elo”–yElo*. It doesn’t have to be limited to calendar years, as the same approach would be useful to comparing, say, 20-match segments. It allows us to take advantage of the Elo algorithm–and the well-informed ratings of other players–to measure partial careers.

* you can pronounce it like the color “yellow,” but I prefer to say it like Phil Dunphy from Modern Family answering the phone.

Muguruza’s 2160 rating sure looks good, so how does it stack up against the rest of the tour? Here’s the 2021 top 20, considering players with at least five match wins through the Dubai and Guadalajara finals last weekend:

Rank  Player                W-L  yElo  
1     Garbine Muguruza     18-4  2160  
2     Naomi Osaka          10-0  2094  
3     Jessica Pegula       15-5  2002  
4     Serena Williams       8-1  1997  
5     Elise Mertens        11-2  1971  
6     Karolina Muchova      7-1  1953  
7     Aryna Sabalenka      11-4  1943  
8     Iga Swiatek          10-3  1941  
9     Daria Kasatkina      10-4  1910  
10    Barbora Krejcikova   10-5  1905  
11    Shelby Rogers         9-4  1902  
12    Jil Teichmann         9-5  1899  
13    Anett Kontaveit       9-4  1897  
14    Jennifer Brady        9-4  1892  
15    Cori Gauff           11-5  1885  
16    Danielle Collins      9-4  1883  
17    Ashleigh Barty        8-2  1878  
18    Sara Sorribes Tormo   9-2  1867  
19    Ann Li                5-1  1864  
20    Simona Halep          6-2  1854 

Like any Race list in March, this isn’t really reflective of skill. But when we consider the small amount of data it has to work with for each player, it’s … pretty good?

Again, you can quibble over whether Osaka or Muguruza has had the better season, but this approach weighs the better winning percentage and stronger average opponent against the much higher absolute win count and gives us a credible answer. Muguruza’s additional evidence of good tennis playing puts her ahead of Osaka’s evidence of short-term unbeatability.

While yElo is basically just a toy–it certainly doesn’t have the same predictive value as regular Elo–this initial look makes me like it. The possibilities are endless, from more sophisticated race tracking, to ranking the greatest seasons of all time, to comparing a player’s current hot streak to what’s she’s done in the past. Stay tuned, as I’m sure I’ll have more yElo results to report in the future.

So, About Those Stale Rankings

Both the ATP and WTA have adjusted their official rankings algorithms because of the pandemic. Because many events were cancelled last year (and at least a few more are getting canned this year), and because the tours don’t want to overly penalize players for limiting their travel, they have adopted what is essentially a two-year ranking system. For today’s purposes, the details don’t really matter–the point is that the rankings are based on a longer time frame than usual.

The adjustment is good for people like Roger Federer, who missed 14 months and is still ranked #6. Same for Ashleigh Barty, who didn’t play for 11 months yet returned to action in Australia as the top seed at a major. It’s bad for young players and others who have won a lot of matches lately. Their victories still result in rankings improvements, but they’re stuck behind a lot of players who haven’t done much lately.

The tweaked algorithms reflect the dual purposes of the ranking system. On the one hand, they aim to list the best players, in order. On the other hand, they try to maintain other kinds of “fairness” and serve the purposes of the tours and certain events. The ATP and WTA computers are pretty good at properly ranking players, even if other algorithms are better. Because the pandemic has forced a bunch of adjustments, it stands to reason that the formulas aren’t as good as they usually are at that fundamental task.

Hypothesis

We can test this!

Imagine that we have a definitive list, handed down from God (or Martina Navratilova), that ranks the top 100 players according to their ability right now. No “fairness,” no catering to the what tournament owners want, and no debates–this list is the final word.

The closer a ranking table matches this definite list, the better, right? There are statistics for this kind of thing, and I’ll be using one called the Kendall rank correlation coefficient, or Kendall’s tau. (That’s the Greek letter τ, as in Τσιτσιπάς.) It compares lists of rankings, and if two lists are identical, tau = 1. If there is no correlation whatsoever, tau = 0. Higher tau, stronger relationship between the lists.

My hypothesis is that the official rankings have gotten worse, in the sense that the pandemic-related algorithm adjustments result in a list that is less closely related to that authoritative, handed-down-from-Martina list. In other words, tau has decreased.

We don’t have a definitive list, but we do have Elo. Elo ratings are designed for only one purpose, and my version of the algorithm does that job pretty well. For the most part, my Elo formula has not changed due to the pandemic*, so it serves as a constant reference point against which we can compare the official rankings.

* This isn’t quite true, because my algorithm usually has an injury/absence penalty that kicks in after a player is out of action for about two months. Because the pandemic caused all sorts of absences for all sorts of reasons, I’ve suspended that penalty until things are a bit more normal.

Tau meets the rankings

Here is the current ATP top ten, including Elo rankings:

Player       ATP  Elo  
Djokovic       1    1  
Nadal          2    2  
Medvedev       3    3  
Thiem          4    5  
Tsitsipas      5    6  
Federer        6    -  
Zverev         7    7  
Rublev         8    4  
Schwartzman    9   10  
Berrettini    10    8

I’m treating Federer as if he doesn’t have an Elo rating right now, because he hasn’t played for more than a year. If we take the ordering of the other nine players and plug them into the formula for Kendall’s tau, we get 0.778. The exact value doesn’t really tell you anything without context, but it gives you an idea of where we’re starting. While the two lists are fairly similar, with many players ranked identically, there are a couple of differences, like Elo’s higher estimate of Andrey Rublev and its swapping of Diego Schwartzman and Matteo Berrettini.

Let’s do the same exercise with a bigger group of players. I’ll take the top 100 players in the ATP rankings who met the modest playing time minimum to also have a current Elo rating. Plug in those lists to the formula, and we get 0.705.

This is where my hypothesis falls apart. I ran the same numbers on year-end ATP rankings and year-end Elo ratings all the way back to 1990. The average tau over those 30-plus years is about 0.68. In other words, if we accept that Elo ratings are doing their job (and they are indeed about as predictive as usual), it looks like the pandemic-adjusted official rankings are better than usual, not worse.

Here’s the year-by-year tau values, with a tau value based on current rankings as the right-most data point:

And the same for the WTA, to confirm that the result isn’t just a quirk of the makeup of the men’s tour:

The 30-year average for women’s rankings is 0.723, and the current tau value is 0.764.

What about…

You might wonder if the pandemic is wreaking some hidden havoc with the data set. Remember, I said that I’m only considering players who meet the playing time minimum to have an Elo rating. For this purpose, that’s 20 matches over 52 weeks, which excludes about one-third of top-100 ranked men and closer to half of top-100 women. The above calculations still consider 100 players for year-end 2020 and today, but I had to go deeper in the rankings to find them. Thus, the definition of “top 100” shifts a bit from year-end 2019 to year-end 2020 to the present.

We can’t entirely address this problem, because the pandemic has messed with things in many dimensions. It isn’t anything close to a true natural experiment. But we can look only at “true” top-100 players, even if the length of the list is smaller than usual for current rankings. So instead of taking the top 100 qualifying players (those who meet a playing time minimum and thus have an Elo ranking), we take a smaller number of players, all of whom have top-100 rankings on the official list.

The results are the same. For men, the tau based on today’s rankings and today’s Elo ratings is 0.694 versus the historical average of 0.678. For women, it’s 0.721 versus 0.719.

Still, the rankings feel awfully stale. The key issue is one that Elo can’t help us solve. So far, we’ve been looking at players who are keeping active. But the really out-of-date names on the official lists are the ones who have stayed home. Should Federer still be #6? Heck if I know! In the past, if an elite player missed 14 months, Elo would knock him down a couple hundred points, and if that adjustment were applied to Fed now, it would push down tau. But there’s no straightforward answer for how the inactive (or mostly inactive) players should be rated.

What we’ve learned today

This is the part of the post where I’m supposed to explain why this finding makes sense and why we should have suspected it all along. I don’t think I can manage that.

A good way to think about this might be that there is a sort of tour-within-a-tour that is continuing to play regularly. Federer, Barty, and many others haven’t usually been part of it, while several dozen players are competing as often as they can. The relative rankings of that second group are pretty good.

It doesn’t seem quite fair that Clara Tauson is stuck just inside the top 100 while her Elo is already top-50, or that Rublev remains behind Federer despite an eye-popping six months of results while Roger sat at home. And for some historical considerations–say, weeks inside the top 50 for Tauson or the top 5 for Rublev–maybe it isn’t fair that they’re stuck behind peers who are choosing not to play, or who are resting on the laurels of 18-month-old wins.

But in other important ways, the absolute rankings often don’t matter. Rublev has been a top-five seed at every event he’s played since late September except for Roland Garros, the Tour Finals, and the Australian Open, despite never being ranked above #8. When the tour-within-a-tour plays, he is a top-five guy. The likes of Rublev and Tauson will continue to have the deck slightly stacked against them at the majors, but even that disadvantage will steadily erode if they continue to play at their current levels.

Believing in science as I do, I will take these findings to heart. That means I’ll continue to complain about the problems with the official rankings–but no more than I did before the pandemic.

How Much Does Naomi Osaka Raise Her Game?

You’ve probably heard the stat by now. When Naomi Osaka reaches the quarter-final of a major, she’s 12-0. That’s unprecedented, and it’s especially unexpected from a player who doesn’t exactly pile up hardware outside of the hard court grand slams.

It sure looks like Osaka finds another level as she approaches the business end of a major. Translated to analytics-speak, “she raises her game” can be interpreted as “she plays better than her rating implies.” That is certainly true for Osaka. She has won 16 of her 18 matches in the fourth round or later of a slam, often in matchups that didn’t appear to favor her. In her first title run, at the 2018 US Open, my Elo ratings gave her 36%, 53%, 46%, and 43% chances of winning her fourth-round, quarter-final, semi-final, and final-round matches, respectively.

Had Osaka performed at her expected level for each of her 18 second-week matches, we’d expect her to have won 10.7 of them. Instead, she won 16. The probability that she would have won 16 or more of the 18 matches is approximately 1 in 200. Either the model is selling her short, or she’s playing in a way that breaks the model.

Estimating lift

Osaka’s results in the second week of slams are vastly better than the other 93% or so of her tour-level career. It’s possible that it’s entirely down to luck–after all, things with a 0.5% chance of happening have a habit of occurring about 0.5% of the time, not never. When those rare events do take place, onlookers are very resourceful when it comes to explaining them. You might believe Osaka’s claims about caring more on the big stage, but we should keep in mind that whenever the unlikely happens, a plausible justification often follows.

Recognizing the slim possibility that Osaka has taken advantage of some epic good luck but setting it aside, let’s quantify how good she’d have to be for such a performance to not look lucky at all.

That’s a mouthful, so let me explain. Going into her 16 second-week slam matches, Osaka’s average surface-blended Elos have been 2,022. That’s good but not great–it’s a tick below Aryna Sabalenka’s hard-court Elo rating right now. Those modest ratings are how we come up with the estimate that Osaka should’ve won 10.7 of her 18 matches, and that she had a 1-in-200 shot of winning 16 or more.

2,022 doesn’t explain Osaka’s success, so the question is: What number does? We could retroactively boost her Elo rating before each of those matches by some amount so that her chance of winning 16-plus out of 18 would be a more believable 50%. What’s that boost? I used a similar methodology a couple of years ago to quantify Rafael Nadal’s feats at his best clay court events, another string of match wins that Elo can’t quite explain.

The answer is 280 Elo rating points. If we retroactively gave Osaka an extra 280 points before each of these 16 matches, the resulting match forecasts would mean that she’d have had a fifty-fifty chance at winning 14 or more of them. Instead of a pre-match average of 2,022, we’re looking at about 2,300, considerably better than anyone on tour right now. (And, ho hum, among the best of all time.) A difference of 280 Elo points is enormous–it’s the difference between #1 and #22 in the current hard-court Elo rating.

Osaka versus the greats

I said before that Osaka’s 12-0 is unprecedented. Her 16-2 in slam second weeks may not have quite the same ring to it, but compared to expectations based on Osaka’s overall tour-level performance, it is every bit as unusual.

Take Serena Williams, another woman who cranks it up a notch when it really matters. Her second-week record, excluding retirements, is 149-39, while the individual forecasts before each match would’ve predicted about 124-64. The chances of a player outperforming expectations to that extent are basically zero. I ran 10,000 simulations, and that’s how many times a player with Serena’s pre-match odds won 147 of the 185 matches. Zero.

For Serena to have had a 50% chance of winning 149 of the 188 second-week contests, her pre-match Elo ratings would’ve had to have been 140 points higher. That’s a big difference, especially on top of the already stellar ratings that she has maintained throughout her career, but it’s only half of the jump we needed to account for Osaka’s exploits. Setting aside the possibility of luck, Osaka raises her level twice as much as Serena does.

One more example. Monica Seles won 70 of her 95 second-week matches at slams, a marked outperformance of the 60 matches that Elo would’ve predicted for her. Like Osaka, her chances of having won 70 instead of 60 based purely on luck are about 1 in 100. But you can account for her actual results by giving her a pre-match Elo bonus of “only” 100 points.

The full context

I ran similar calculations for the 52 women who won a slam, made their first second-week appearance in 1958 or later, and played at least 10 second-week matches. They divide fairly neatly into three groups. 18 of them have career second-week performances that can easily be explained without recourse to good luck or level-raising. In some cases we can even say that they were unlucky or that they performed worse than expected. Ashleigh Barty is one of them: Of her 14 second-week matches, she was expected to win 9.9 but has tallied only 8.

Another 16 have been a bit lucky or slightly raised their level. To use the terms I introduced above, their performances can be accounted for by upping their pre-match Elo ratings by between 10 and 60 points. One example is Venus Williams, who has gone 84-43 in slam second weeks, about six wins better than her pre-match forecasts would’ve predicted.

That leaves 18 players whose second-week performances range from “better than expected” to “holy crap.” I’ve listed each of them below, with their actual wins (“W”), forecasted wins (“eW”), probability of winning their actual total given pre-match forecasts (“p(W)”), and the approximate number of Elo points (“Elo+”) which, when added to their pre-match forecasts, would explain their results by shifting p(W) up to at least 50%.

Player               M    W     eW   p(W)  Elo+  
Naomi Osaka         18   16   10.7   0.5%   280  
Billie Jean King   123   94   76.2   0.0%   160  
Sofia Kenin         10    7    4.7  10.6%   150  
Serena Williams    188  149  124.4   0.0%   140  
Evonne Goolagong    92   69   58.7   0.4%   130  
Jennifer Capriati   70   42   33.2   1.2%   110  
Monica Seles        95   70   60.2   1.2%   100  
Hana Mandlikova     75   49   41.7   3.1%   100  
Kim Clijsters       67   47   40.6   4.6%    90  
Justine Henin       74   55   48.9   6.3%    80  
Mary Pierce         55   28   22.4   6.9%    80  
Li Na               36   22   18.0  10.6%    80  
Steffi Graf        157  131  123.6   6.1%    70  
Maria Bueno         93   70   63.4   6.3%    70  
Garbine Muguruza    31   18   14.9  15.8%    70  
Mima Jausovec       32   18   15.0  15.9%    70  
Marion Bartoli      20   11    8.8  20.6%    70  
Sloane Stephens     24   12    9.7  20.8%    70

There are plenty of names here that we’d comfortably put alongside Williams and Seles as luminaries known for their clutch performances. Still, the difference between Osaka’s levels is on another planet.

Obligatory caveats

Again, of course, Osaka’s results could just be lucky. It doesn’t look that way when she plays, and the qualitative explanations add up, but … it’s possible.

Skeptics might also focus on the breakdown of the 52-player sample. In terms of second-week performance relative to forecasts, only one-third of the players were below average. That doesn’t seem quite right. The “average” woman outperformed expectations by about 30 Elo points.

There are two reasons for that. The first is that my sample is, by definition, made up of slam winners. Those players won at least four second-week matches, no matter how they fared in the rest of their careers. In other words, it’s a non-random sample. But that doesn’t have any relevance to Osaka’s case.

The second, more applicable, reason that more than half of the players look like outperformers is that any pre-match player rating is a measure of the past. Elo isn’t as much of a lagging indicator as, say, official tour rankings, but by its nature, it can only consider past results.

Any player who ascends to the top of the game will, at some point, need to exceed expectations. (If you don’t exceed expectations, you end up with a tennis “career” like mine.) To go from mid-pack to slam winner, you’ll have at least one major where you defy the forecasts, as Osaka did in New York in 2018. Osaka was an extreme case, because she hadn’t done much outside of the slams. If, for instance, Sabalenka were to win the US Open this year, she has done so well elsewhere that it wouldn’t be the same kind of shock, but it would still be a bit of a surprise.

In other words, almost every player to win a slam had at least one or two majors where they executed better than their previous results offered any reason to expect. That’s one reason why we find Sofia Kenin only two spots below Osaka on the list.

For Serena or Seles, the “rising star” effect doesn’t make much of a difference–those early tournaments are just a drop in the bucket of a long career. Yeah, it might mean they really only up their game by 110 Elo points instead of 130, but it doesn’t call their entire career’s worth of results into question. For Osaka or Kenin, the early results make up a big part of the sample, so this is something to consider.

It will be tougher to Osaka to outperform expectations as the expectations continue to rise. Much depends on whether she continues to struggle away from the big stages. If she continues to manage only one non-major title per year, she’ll keep her rating down and suppress those pre-match forecasts. (The predictions of major media pundits will be harder to keep under control.) Beating the forecasts isn’t necessarily something to aspire to–even though Serena does it, her usual level is so high that we barely notice. But if Osaka is going to alternate levels between world-class and merely very good, she could hardly do better than to bring out her best stuff when she does.

The Post-Covid Tennis World is Unpredictable. The Match Results Are Not.

Both the ATP and WTA patched together seasons in the second half of 2020, providing playing opportunities to competitors who had endured vastly different lockdowns–some who couldn’t practice for awhile, some who came down with Covid-19, and others who got knee surgery.

When the tours came back, we didn’t know quite what to expect. I’m sure some of the players didn’t know, either. Yet when we take the 2020 season (plus a couple weeks of 2021) as a whole, what happened on court was pretty much what happened before. The Australian Open, with its dozens of players in hard quarantine for two weeks, may change that. But for about five months, players faced all kinds of other unfamiliar challenges, and they responded by posting results that wouldn’t have looked out of place in January 2020.

The Brier end

My usual metric for “predictability” is Brier Score, which measures both accuracy (did our pre-match favorite win?) and confidence (if we think four players are all 75% favorites, did three of them win?). Pre-match odds are determined by my Elo ratings, which are far from the final word, but are more than sufficient for these purposes. My tour-wide Brier Scores are usually in the neighborhood of 0.21, several steps better than the 0.25 Brier that results from pure coin-flipping. A lower score indicates more accurate forecasts and/or better calibrated confidence levels.

Here are the tour-wide Brier Scores for the ATP and WTA since the late-summer restart:

  • ATP: 0.213 (2017 – early 2020: 0.212)
  • WTA: 0.192 (2017 – early 2020: 0.212)

The ATP’s level of predictability is so steady that it’s almost suspicious, while the WTA has somehow been more predictable since the restart.

But we aren’t quite comparing apples to apples. The post-restart WTA was sparser than the pre-Covid women’s tour, and the post-restart ATP was closer to its pre-pandemic normal.

Let’s look at a few things that do line up. Most of the top players showed up for the main events of the restarted tour, such as the US Open, Roland Garros, Rome, “Cincinnati” (played in New York), and men’s Masters event in Paris. Here are the 2019 and 2020 Brier Scores for each of those events:

Event          Men '19  Men '20  Women '19  Women '20  
Cincinnati       0.244    0.210      0.244      0.252  
US Open          0.210    0.167      0.178      0.186  
Roland Garros    0.163    0.199      0.191      0.226  
Rome             0.209    0.274      0.205      0.232  
Paris            0.226    0.199          -          -  
---
Total            0.204    0.202      0.198      0.218

(If you want even more numbers, I did similar calculations in August after Palermo, Lexington, and Prague.)

Three takeaways from this exercise:

  • Brier Scores are noisy. Any single tournament number can be heavily affected by a few major upsets.
  • Man, those ATP dudes were steady.
  • The WTA situation is more complicated than I thought.

Whether we look at the entire post-restart tour or solely the big events, the story on the ATP side is clear. Long layoffs, tournament bubbles, missing towelkids, Hawkeye Live … none of it had much effect on the status quo.

The predictability of the women’s tour is another thing entirely. The 12 top-level events between Palermo in July and Abu Dhabi in January were easier to forecast than a random sampling of a dozen tournaments from, say, 2018. But the four biggest events deviated from the script considerably more than they had in 2019 (or 2017 or 2018, for that matter).

From this, I offer a few tentative conclusions:

  • Big events, with their disproportionate number of star-versus-star matches, are a bit more predictable than other tournaments.
  • Accordingly, the post-restart WTA wasn’t as predictable as it first appeared. It was just lopsided in favor of tournaments that drew (most of) the top stars. Had the women’s tour featured a wider variety of events–which probably would’ve included a larger group of players, including some fringier ones–it’s post-restart Brier Score would’ve been higher. Perhaps even higher than the corresponding pre-Covid number.
  • Most tentative of all: The predictability of ATP and WTA match results might have itself been affected by the availability of tournaments. Top men were able to get into something like their usual groove, despite the weirdness of virus testing and empty stadiums. Most women never got a chance to play more than two or three weeks in a row.

Even six months after Palermo, the data is still limited. And by the time we have enough match results to do proper comparisons, some things will have gotten back to normal (hopefully!), complicating the analysis even further. That said, these findings are much clearer than my initial forays into post-restart Brier Scores in August. As for the Australian Open, quarantine and all, I’m forecasting a predictable tournament. At least for the men.

Not All Twenties Are Created Equal

The top of the all-time men’s grand slam ranking just got even more crowded. With his 13th Roland Garros title, Rafael Nadal has matched Roger Federer at the top of the list by securing his 20th major title. Novak Djokovic, Nadal’s final obstacle en route to the historic mark, remains within shouting distance with 17 slams.

The Roger-Rafa tie has spurred another (interminable, unresolvable) round of the (interminable, unresolvable) GOAT debate. Of course there’s much more to determining the best ever than the slam count. But the slam count is a big part of the conversation. If we’re going to keep doing this, we ought to at least recognize that not all major titles are created equal. And by extension, not all collections of twenty major titles are equivalent.

We all have intuitions about the difficulty of how a particular draw shakes out, with its typical mix of good and bad fortune. Nadal was lucky that he missed a few dangerous opponents in the early rounds, luckier still that he didn’t have to face Dominic Thiem in the semi-final, and unfortunate that he had to face down the next-best player in the draw, Djokovic, in the final. As it turned out, it didn’t really matter, but I think most of us would agree that Nadal’s achievement–staggering as it is–would look even better had he faced more than two more players ranked in the top 70.

Stop dithering and start calculating

I’ve written about this before, and I’ve established a metric to quantify those intuitions. Take the surface-weighted Elo rating of each of a player’s opponents, and determine the probability that an average slam champion would beat those players. After a couple of steps to normalize the results, we end up with a single number for the path to each slam title. The larger the result, the more difficult the path, and an average slam works out to 1.0.

Nadal’s path was easier than the historical average. Aside from Djokovic, none of his opponents would have had more than an 8% chance of knocking out an average slam champion on clay. The exact result is 0.64, which is easier than almost nine-tenths of majors in the Open Era. Rafa has had three easier paths to his major titles, including the 2017 US Open, which scored only 0.33. That’s the easiest US Open, Wimbledon, or Roland Garros in a half-century.

Of course, he’s had his share of difficult paths, such as 2012 Roland Garros (1.36), when he faced several clay specialists and a peak-level Djokovic. Federer and Djokovic have gotten their own shares of lucky and unlucky draws over the years–that’s why we need a metric. You might have a better memory for this kind of thing than I do, but I don’t think any of us can weigh 57 majors with 7 opponents each and work out any meaningful results in our heads.

The tally

Sum up the difficulty of the title paths for these 57 slams, and here are the results:

Player    Slams  Avg Score  Total  
Nadal        20       0.95   19.0  
Djokovic     17       1.06   18.1  
Federer      20       0.89   17.9  
                                   
Player     Easy     Medium   Hard  
Nadal         7          8      5  
Djokovic      5          5      7  
Federer       9         10      1

The first table shows each player’s average score for the paths to his major titles, and the total number of “adjusted slams” that gives them. Nadal is in the lead with 19, and Djokovic and Federer follow in a near-tie, just above and below 18.

You might be surprised to see the implication that this is a slightly weak era, with average scores a bit below 1.0. That wasn’t the case a few years ago, but there has only been one above-average title path since 2016. The Big Three-or-Four has generally stayed out of each other’s way since then, and even when they do clash, as they did yesterday, the leading contenders for quarter-final or semi-final challenges failed to make it that far. The average score of the last 15 slam title paths is a mere 0.73, while the 16 before that (spanning 2013-16) averaged 1.20.

The second table paints with a broader brush, classifying all Open Era slam titles into thirds: “easy,” “medium” and “hard” paths to the championship. Anything below 0.89 rates as “easy,” anything above 1.14 is marked as “hard,” with the remainder left as “medium.”

Djokovic is the leader in hard slams, with 7 of his 17 meriting that classification. Federer has racked up 10 medium slams, including several that score above 1.0, but only one that cleared the bar for the “hard” category. Nadal’s mix is more balanced.

Go yell at someone else

Hopefully these numbers have given you some new ammunition for your next twitter fight. Some of you will froth at the mouth while insisting that players can’t control who they play. You’re right, but it doesn’t really matter. We can’t start giving out GOAT points for things that players didn’t do, like beat Thiem in the 2020 French Open semi-finals. All three of these guys were or are good enough at various points to have beaten some of the opponents they didn’t have to face. There are other approaches we could take to the GOAT debate that incorporate peak Elo ratings and longevity at various levels, but that’s not what we’re talking about when we count slams.

If we are going to focus so much on the slam count, we might as well acknowledge that Nadal’s 20 is better than Federer’s 20, and Djokovic’s 17 is awfully close to both of them.