The Challenger Warrior Index (for Damian)

This post is dedicated to the memory of Damian Kust, tennis journalist and honorary Challenger warrior. He died this month at the age of 26.

Whatever it is that makes the Challenger tour compelling, it isn’t just the rising stars. Sure, when a Sinner or a Fonseca tears through the ranks, we tune in. Challenger-level competition is a litmus test, and we want to know whether the buzz is justified. But tomorrow’s all-world stars are just passing through. Fonseca played all of 56 matches at the level, and he’s already top-30. Sinner played 42. Federer played one.

If you’re the sort of person who is attracted to Challenger-level tennis, I suspect that the struggle is part of the appeal. Three-hour marathons, qualifying cuts, third-set cramps, tough losses to teenagers and aging veterans alike. We’re drawn to the sort of player who slogs away on Court 2 long after the rising-star top seed advances on Center.

Maybe this is something that can’t be quantified. But hey, what am I here for if not to stick numbers where they don’t belong?

Hence, the Challenger Warrior Index.

Challenger warriors are the guys who win matches the hard way. (If they could do it the easy way, I’m sure they would, but then they’d be playing bigger events.) The trick, when it comes to ranking “warrior-ness,” is to balance winning with fighting. The Index gives credit for victories and ranking improvements, yet it also boosts players for showing up often, especially when they push their opponents to the brink.

Here’s how it works. For the entire previous season, players get points for each of the following at Challengers and slam qualifying:

  • 3 points per match, plus 2 points for each match win;
  • 2 additional points for a three-setter, another 2 points if they win it;
  • 1 point for each tiebreak, an extra two points if it’s a deciding TB, a bonus three points if they win it;
  • 2 extra points per match that hits the three-hour mark;
  • 5 points for reaching a final, another 5 points per title;
  • 1 point per ranking place gained over the season, up to a maximum of 100;
  • 20 point bonus for a year-end ranking inside the top 100 (AO main draw!)

The various 3-set bonuses are doubled for five-set matches in slam qualifying.

I don’t claim that this is the final word: I tinkered, and I’m making it up as I go along. Like I said, this isn’t the sort of thing that is meant to be quantified. Your personal Index would probably weight things differently.

2025 warriors

Here are the official, indefatigable warriors of the 2025 Challenger tour:

CWI  Player                    Matches  Titles  Rkg Gain  
588  Francesco Maestrelli           72       3       103  
586  Eliot Spizzirri                65       2       139  
560  Emilio Nava                    67       4       124  
542  Liam Draxl                     66       1       114  
539  Joao Lucas Reis Da Silva       77       1       194  
520  Roman Andres Burruchaga        71       3        51  
519  Ignacio Buse                   64       2       132  
516  Marco Cecchinato               72       1       147  
510  Viktor Durasovic               58       1       176  
509  Juan Carlos Prado Angelo       70       1        78

Maestrelli and Spizzirri come out in a near tie. Fittingly, the Italian triumphs by virtue of playing a few more matches.

The points-weighting, however arbitrary, works out nicely, rewarding differently playing styles and surface preferences. Everyone near the top of the list enjoyed a significant ranking boost over the course of the year, partly because of the points it earns, and partly because ranking boosts tends to go hand-in-hand with playing and winning a lot of Challenger matches.

As if on cue, Maestrelli is delivering on his warrior status this week, with two victories so far in Melbourne qualies. Even more appropriately, Draxl has done the same, thanks to a third-set tiebreak victory over Vitaliy Sachko to finish today’s session.

Here is the CWI roll of honor, going back another decade:

Year  CWI  Player                   Matches  Titles  Rkg Gain  
2024  587  Tristan Boyer                 71       3       135  
2023  589  Facundo Diaz Acosta           66       4        96  
2022  603  Matteo Arnaldi                80       1       229  
2021  634  Benjamin Bonzi                69       6       101  
2020  357  Aslan Karatsev                38       2       177  
2019  583  James Duckworth               71       4       134  
2018  601  Cristian Garin                71       3       227  
2017  660  Blaz Kavcic                   75       2       120  
2016  590  Gerald Melzer                 66       4        98  
2015  632  Daniel Munoz De La Nava       70       3       131

Arnaldi’s 80-match campaign was an impressive effort, the last one to merit a Warrior Index over 600. But the overall champion is Blaz Kavcic. In 2017, he played a whopping 32 three-setters, winning an even more eye-popping 25 of them. Five of the third sets went to a tiebreak, and he won them all. While none of those matches crossed the three-hour mark (Marco Cecchinato was the 2017 champ in that category), there’s no doubt that Kavcic showed up ready for battle, all year long.

There are more ways to measure Challenger success than future fame and fortune. I hope the Warrior Index points at some of the reasons these players deserve our admiration, no matter what their career peak ranking turns out to be.
The Decline of Specialization (Or, The Rising Floor)

You might have heard that Jannik Sinner did something in 2025 that no one has ever done before. For the first time since modern statkeeping began in 1991, he led the tour in both hold percentage and return percentage. There’s a caveat here, because Sinner missed most of the clay season, which might have dragged down his return numbers relative to the field. Still, it’s a tremendous accomplishment.

Only a few players have ever come close. Novak Djokovic ranked first in hold percentage and third in break percentage in 2023, and Andre Agassi reversed those rankings in 1999. In 1995, Agassi had placed third in both categories. Only a handful of others–basically the Big Three–have ever cracked both top fives simultaneously.

We owe this whole framework to Cracked Racquets majordomo Alex Gruskin. He likes to talk about “clubs” of players who rank in the top 10, or top 25, or whatever, of both hold and break percentage. It’s a great way to quickly identify the best all-around players on tour. “Top 25” may not sound impressive, but this past year, only nine men made the cut. Doing so is a near guarantee of a top-ten finish. Only Casper Ruud (year-end #12) and Grigor Dimitrov (injured since Wimbledon) were top-25-clubbers without also finishing top ten in the rankings.

Sinner, then, is on another planet, and most players are lucky to sniff the top ten in one category, let alone both. That said, the number of all-around superstars is creeping upwards.

Three guys–Sinner, Djokovic, and Carlos Alcaraz–qualified for the top ten club this year. Jack Draper just missed, finishing 11th in break percentage. Excluding the 2020 Covid season, this is only the fifth time since 1991 that three men qualified. All but of those seasons have come since 2019. The most common number of top-ten-clubbers in a single year is one. There times in the 1990s, there were zero.

The story is similar regardless of the threshold. 2023 saw nine top-20 clubbers, the most ever. For the first fifteen years of ATP statkeeping, the average season delivered fewer top-25 finishers than that.

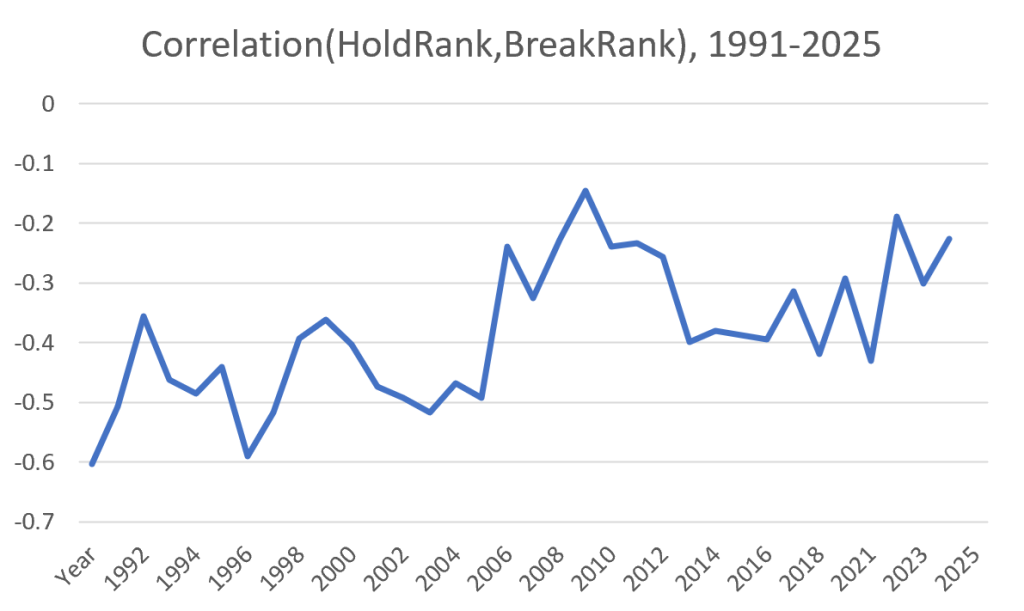
The trend is clearest when we boil it down to one number. For every season since 1991, I took the top 50 from the year-end rankings and worked out their positions on the hold and break percentage lists. This graph shows the correlation between hold ranking and break ranking for each campaign:

A correlation of zero would mean that there was no relationship between a player’s hold and break ranks; negative means that if someone is high in one category, they are more likely to be low in the other. Of course, it’s a matter of degree. Over time, the inverse relationship between serving and returning skill has eroded. We hit peak well-roundedness around 2010, and we appear to be back in a similar state of affairs.

Why?

This is where it gets interesting. (And, I’ll admit, rather speculative.)

In sports (and the economy in general), specialization tends to increase over time. We rarely see multi-sport athletes these days. NFL players once played both offense and defense; now specialists handle each side of the ball. Baseball teams once got through entire seasons with a handful of pitchers; now it can take as many arms to get through a single game. Specific skillsets are deployed to handle right-handers, left-handers, and the late innings.

This has happened in tennis, too, kind of. There has probably never been a better server than John Isner. Never a stronger returner than Novak Djokovic. Setting aside skills that have fallen into the background in today’s game (everything associated with net play), the best of every specific thing is on display now, or has been recently. This isn’t to say that Richard Gonzalez, or Ken Rosewall, or Ivan Lendl couldn’t have done it better. They just didn’t have the chance. Modern sports encourage early specialization. The whole ecosystem then delivers training, coaching, and equipment that yesterday’s greats never dreamed of.

But! Isner only (“only”) peaked at #8. Diego Schwartzman, who at his best rivaled Djokovic as the sport’s most brilliant returner, also topped out at #8. We all know why: Neither one was very good at the other half of the game, at least by pro standards. In the NFL, half of a player’s job was handed to someone else who was better at it. At the Olympics, the entries in the 400 meters and the 800 meters can be given to different athletes. In tennis, though, Isner’s gotta hit the returns, and Peque had to serve.

Player development, then, becomes a sort of optimization problem. Do you find the most extreme physical specimens you can, then coach them to adequacy in the skills that don’t come naturally? Or do you look for all-around talents, even if they’ll never hit a 140-mile-per-hour serve?

The answer isn’t obvious. But the trend is moving toward the latter. I think I can explain why.

In short, we’ve reached peak server. You could find players with the potential to develop bigger weapons than those of Sinner, Draper, Ben Shelton, Alexander Bublik, and the like. But they’re already holding 85% of the time. Even Ruud and Alex de Minaur, with their limited first-strike capabilities, are able to hold nearly that often. At the risk of a misleading pun, we’ve reached diminishing marginal returns. A better server might eke out another percentage point or two, but at what cost? A whole lot of guys would love to have Shelton’s serve, but would they take the Shelton return along with it?

Specialization is in decline because the floor keeps rising. A few generations ago, a one-dimensional savant with a monster serve or a wizardly backhand could rocket into the top 20 because not enough opponents could stop them. Now, Reilly Opelka might hit 30 aces, or he might get broken three times by #92 in the world. There are probably guys out there who could serve even bigger than Opelka or Bublik, or maybe even return better than de Minaur. But if they can’t meet a (steadily increasing) minimum level of competence on the other side of the ball, they’re marooned on the ITF tour, at best.

This, too, has parallels in other sports. Really, any sport where coaches are stuck with the same athletes on offense and defense. In the NBA, versatility is prized like never before. In baseball, teams are less likely to carry a slugger who is a liability in the field. There are just too many other options: Why use a limited player when an almost-as-good hitter could give you considerably better defense?

Think about it: In the ATP top 50, are there any bad servers? A few South Americans, plus Corentin Moutet. Learner Tien has some development yet to come, and that’s about it. Bad returners? Sure, a few, but any as weak as Isner was? (Or, heaven forbid, as Ivo Karlovic?) When Opelka was coming up through the ranks, everyone raved about how his backhand was in another class than Isner’s. Shelton’s game is incomplete, but he has a lot of skills on the ground. No one would call him hopeless out there. All of his natural talent and hard work translated to 47th out of the top 50 this year in break percentage.

Some of this is thanks to equipment. Modern rackets and strings make it possible to return more first serves, with control. Those thread-the-needle passing shots that everyone can hit these days? A couple of generations ago, they were little more than swing-and-pray low-percentage lunges. Technical advances benefit everybody, but they probably do more to shrink the gap between the haves and the almost-haves than they do to increase it.

Beyond that, we’re watching the natural outcome of an individual sport with an ever-expanding talent pool. Hyper-specialization won’t get you to the top, so well-roundedness is the only option. With millions of kids growing up watching Carlos Alcaraz, the bar will continue to rise on both sides of the ball.

The Most Exclusive Clubs In Tennis

The new Big Two?

Tireless podcaster Alex Gruskin likes to talk about what he calls the “top-ten, top-15, top-20, and top-25 clubs.” He works out the membership of each one by consulting the Tennis Abstract ATP and WTA stats leaderboards, which display dozens of metrics for each of the top 50 ranked players on both tours.

To qualify for Alex’s “top ten club,” a player needs to be in the top ten in both hold percentage and break percentage–in other words, to be an elite server and returner. Even cracking the top 25 club is no easy task. In 2023, only 11 men were better than half of the top 50 on both sides of the ball. It’s more common to excel at one or the other. In 2022, the best returner (Diego Schwartzman) ranked 50th out of 50 on serve, and the best server (Nick Kyrgios) came in 40th on return.

The top-25 club is a high standard, and the top-ten club is a stratospheric one. This year, only three men–Novak Djokovic, Jannik Sinner, and Carlos Alcaraz–made the cut, and Alcaraz almost missed it, ranking 10th in hold percentage. Daniil Medvedev almost qualified, but he trailed Alcaraz by 0.7% in hold percentage and came in 11th in that category.

Three top-ten clubbers is, as it turns out, an unusual showing. In the 33 seasons for which we have the necessary stats to calculate hold and break percentage (back to 1991), only 13 men have ever managed the feat. Many of them did it several times, so there are a total of 49 player-seasons that qualify. For the two-plus decades between 1991 and 2011, there were only two seasons in which more than one player reached both top-ten thresholds. In 1992, the entire tour fell short.

By “club” standards (and most others), Djokovic’s 2023 season was particularly impressive. Alex usually classifies players into round-number clubs, occasionally giving credit to a near-miss who makes, for instance, the “top 26” club. We can extend the concept a bit further and place every season into its best possible club: If a player ranks in the top three by both hold and break percentage, he’s in the “top-three” club; if he ranks among the top four in both, he’s in the “top-four club,” and so on.

In 2023, Novak led the tour in hold percentage and was bested by only Alcaraz and Medvedev in break percentage. Thus, he’s a member of the top-three club. More exclusive categories are hard to find. Here’s the complete list of top-three clubbers since 1991, along with their ranks in hold percentage (H% Rk) and break percentage (B% Rk):

Year  Player          H% Rk  B% Rk  CLUB  
2023  Novak Djokovic      1      3     3  
1999  Andre Agassi        3      1     3  
1995  Andre Agassi        3      3     3  

That’s it.

Sinner’s 2023 campaign was also sneakily great. He finished a deceptive fourth on the official ATP points table, but by ranking fifth in hold percentage and fourth in break percentage, he joined an absurdly elite group of top-five clubbers: only Djokovic, Agassi, Rafael Nadal, and Roger Federer.

Here’s the full list of top-ten club seasons since 1991:

Year  Player            H% Rk  B% Rk  CLUB  
2023  Novak Djokovic        1      3     3  
1999  Andre Agassi          3      1     3  
1995  Andre Agassi          3      3     3  
2021  Novak Djokovic        4      3     4  
2013  Rafael Nadal          4      1     4  
2008  Rafael Nadal          4      1     4  
2002  Andre Agassi          4      3     4  
2023  Jannik Sinner         5      4     5  
2019  Rafael Nadal          5      1     5  
2017  Rafael Nadal          5      2     5  
2015  Novak Djokovic        5      1     5  
2014  Novak Djokovic        5      2     5  
2012  Rafael Nadal          5      1     5  
2007  Rafael Nadal          5      2     5  
2006  Roger Federer         2      5     5  
2003  Andre Agassi          5      3     5  
                                            
Year  Player            H% Rk  B% Rk  CLUB  
2022  Novak Djokovic        6      4     6  
2013  Novak Djokovic        6      2     6  
2021  Daniil Medvedev       7      4     7  
2020  Rafael Nadal          7      2     7  
2019  Novak Djokovic        7      2     7  
2012  Novak Djokovic        7      2     7  
2011  Novak Djokovic        7      1     7  
2010  Rafael Nadal          2      7     7  
2008  Novak Djokovic        7      4     7  
2004  Roger Federer         2      7     7  
2021  Alexander Zverev      8      7     8  
2020  Daniil Medvedev       8      8     8  
2018  Novak Djokovic        8      5     8  
2016  Novak Djokovic        8      2     8  
2015  Roger Federer         4      8     8  
2005  Roger Federer         2      8     8  
2001  Andre Agassi          8      3     8  
1998  Marcelo Rios          8      2     8  
1991  Stefan Edberg         4      8     8  
                                            
Year  Player            H% Rk  B% Rk  CLUB  
2022  Daniil Medvedev       8      9     9  
2020  Andrey Rublev         9      5     9  
2018  Rafael Nadal          9      1     9  
2017  Roger Federer         2      9     9  
2009  Andy Murray           9      2     9  
2007  Roger Federer         3      9     9  
2000  Andre Agassi          8      9     9  
2023  Carlos Alcaraz       10      1    10  
2020  Novak Djokovic       10      4    10  
2019  Roger Federer         3     10    10  
2013  Roger Federer         7     10    10  
1998  Andre Agassi         10      3    10  
1994  Andre Agassi         10      5    10  
1993  Thomas Muster        10      4    10

The list is heavily weighted toward the Big Three and the current era. Whether it’s surface speed convergence or something about the players themselves, it’s tougher to reach the top with a lopsided game these days. Stefan Edberg was a top-eight clubber in 1991 (and might have been as good for several seasons before that), but Pete Sampras didn’t get anywhere close. His best showing by this metric came in 1997, when he cracked the top-14 club. Andy Roddick never even cleared the top 30.

Finally, here are the 15 men who reached both top-30 thresholds in 2023:

Year  Player            H% Rk  B% Rk  CLUB  
2023  Novak Djokovic        1      3     3  
2023  Jannik Sinner         5      4     5  
2023  Carlos Alcaraz       10      1    10  
2023  Daniil Medvedev      11      2    11  
2023  Andrey Rublev        17     11    17  
2023  Karen Khachanov      18     16    18  
2023  Alexander Zverev     15     18    18  
2023  Grigor Dimitrov      19     15    19  
2023  Taylor Fritz          6     19    19  
2023  Casper Ruud          21     17    21  
2023  Holger Rune          20     21    21  
2023  Frances Tiafoe        9     26    26  
2023  Ugo Humbert          29     23    29  
2023  Roman Safiullin      30     24    30  
2023  Sebastian Korda      14     30    30

Women’s clubs

The WTA gets the short shrift on topics like these, because much less historical data is available. I only have the necessary stats back to 2015, and even that season is incomplete.

Still, that doesn’t make some recent individual performances any less impressive. Iga Swiatek’s effort in 2023 predictably stands out: She came in third behind Aryna Sabalenka and Caroline Garcia in hold percentage, and she trailed only Sara Sorribes Tormo and Lesia Tsurenko in break percentage. By finishing third in both categories, she–like Djokovic–is a member of the top-three club.

Depending on how you define a full-season, Iga might be the first ever woman to reach such a standard, at least in the nine-year span for which we can do the math. Here is the full list of top-ten clubbers back to 2015:

Year  Player             H% Rk  B% Rk  CLUB  
2016  Victoria Azarenka      2      1     2  
2023  Iga Swiatek            3      3     3  
2022  Iga Swiatek            5      1     5  
2019  Serena Williams        1      6     6  
2015  Serena Williams        1      7     7  
2016  Serena Williams        1      8     8  
2016  Angelique Kerber      10      6    10 

Azarenka’s run in 2016 was really a partial season: She hurt her knee and didn’t play again after retiring from her first-round match at the French. Her first four months of tennis put her on the path toward a historic campaign, but we’ll never know how it would have turned out. Those 29 matches can’t really be set along the same measuring stick as Iga’s 75-plus in each of the last two years. Serena’s three entries on this table were almost as abbreviated, but again we’re reminded of the limited data. Surely the list would be much longer, with many more instances of the Williams name, if we had better data.

Anyway, all hail the great Iga. May her reign last until Sabalenka figures out how to become a top-ten returner.

At least this year, it was slightly harder to crack the top-25 and top-30 clubs in the women’s game than it was in the men’s. Here is the full 2023 women’s list down to the top-32 threshold, which allows us to include a few names of interest who missed out on the top 30:

Year  Player               H% Rk  B% Rk  CLUB  
2023  Iga Swiatek              3      3     3  
2023  Cori Gauff              13      8    13  
2023  Jessica Pegula          16      5    16  
2023  Madison Keys             6     16    16  
2023  Barbora Krejcikova      12     18    18  
2023  Victoria Azarenka       19     17    19  
2023  Aryna Sabalenka          1     20    20  
2023  Marketa Vondrousova     22      6    22  
2023  Karolina Muchova         8     22    22  
2023  Leylah Fernandez        20     27    27  
2023  Jelena Ostapenko        28     12    28  
2023  Marie Bouzkova          29     21    29  
2023  Caroline Dolehide       23     30    30  
2023  Elina Svitolina         31     24    31  
2023  Beatriz Haddad Maia     18     31    31  
2023  Ons Jabeur              32      9    32  
2023  Belinda Bencic           5     32    32

More than ever, a well-rounded game is a necessity for players who hope to reach the top. For fans, “clubs” like these are a useful way to think about which stars are getting the job done on both sides of the ball.

* * *

I’ll be writing more about analytics and present-day tennis in 2024. Subscribe to the blog to receive each new post by email:


The Best 22-Match yElo Streaks

Earlier this week I wrote about Garbine Muguruza’s outstanding start to the season, and I introduced a new method to quantify a player’s level in a relatively short time span. Instead of using traditional Elo, which takes into account everything we know about a player, my new metric, yElo, uses what we know about everyone else, but treats a player’s short-term performance as if it is all we know about her. The parameters for yElo, such as k-value, are the same as the ones I’ve arrived at to make “regular Elo” as predictive as possible.

In other words, we measure Muguruza’s 22 matches in 2021 as if she had never played a WTA event before. As we saw in my earlier post, this approach considers the strength of opponents each player faced, and it rates her 18-4 record as better than anyone else in 2021, including Naomi Osaka’s 10-0 start.*

* excluding walkovers, which I ignore for all versions of Elo and yElo.

Muguruza’s season start has been outstanding and it is definitely underrated by the official WTA rankings and maybe even by the race, but I don’t want to make too much of it–one title in five tournaments in hardly world-historical stuff. On the other hand, it’s a good way to get our feet wet with a new metric that I think will prove useful for a wide range of tennis comparisons.

Garbine vs Garbine

The Spaniard won majors in 2016 and 2017, and she briefly reached number one in the rankings in September of 2017. Those achievements belong on a Hall of Fame plaque over her recent Dubai title and Yarra River Classic final. But was she really playing better back then?

She was not! I ran the yElo formula for every 22-match sequence in Muguruza’s career. The best of the bunch–again, taken entirely out of context, as if we know nothing beyond those 22 matches–was a run late in 2015 when she reached the Wuhan final, won Beijing, then went undefeated in the WTA Finals round robin stage. Her yElo based on those 22 matches was 2172, narrowly better than her 2021 yElo of 2160.

The more memorable moments of her career don’t quite stack up:

Elo   W-L   Span                            
2172  17-5  2015 Wim R16 - WTA Finals RR    
2160  18-4  2021 Abu Dhabi R64 - Dubai F    
2148  18-4  2017 Birmingham R32 - Cinci F   
2122  19-3  2017 Wimb R128 - USO R16 (#1)   
2084  17-5  2017 Miami R64 - Wimb F         
2076  16-6  2016 Doha QF - Roland Garros F 

I haven’t shown every 22-match sequence of her career, because that list is long and boring–the streaks heavily overlap with each other, and thus there are often tiny differences between them. But it is instructive to look at the time periods that ended at key moments.

The best of that bunch was the 22-match run ending with Muguruza’s 6-1 6-0 beatdown of Simona Halep at the 2017 Cincinnati final. That set the stage for her ascent to #1, though the ranking move didn’t happen until after the US Open. That streak is close to her current level. The 22 matches leading up to the official #1 takeover are a bit lower (she lost to Petra Kvitova at the US Open, which was less forgivable then than now), and the timespans ending with her two slam finals are still further down the list.

Don’t misunderstand–Muguruza was playing very well throughout all of these time periods. But when we crunch the numbers, we find that her current level is roughly on par with the best she’s ever played.

Garbine vs the world

Metrics are a lot more informative once we gain some context. Many of you probably have a good sense of what regular Elo ratings mean–2100+ is outstanding, 2000+ is top ten-ish, 1900+ is approximately the top 20, and so on. We can piggyback on that for yElo. When Muguruza’s 22-match yElo this season is 2160, it really does mean that, when feeding that very limited set of results into the Elo formula, it thinks Muguruza’s level is close to that of the best player in the world.

Well… the best player in the world right now. There’s no truly dominant force in women’s tennis at the moment, so we’re not seeing players at the top end of the all-time Elo scale. In regular Elo, peak Martina Navratilova and peak Steffi Graf topped 2600, more than 400 points above Osaka’s current rating of 2189. It will not surprise you, then, to learn that Navratilova, Graf, Serena Williams, Chris Evert, and many others put together 22-match runs* that make Muguruza’s 2021 season look positively pedestrian.

* yes, I know how ridiculous it is that this whole article is based on the arbitrary 22-match time span. We could do the same stuff with the more natural-sounding 20-match span, but there wouldn’t be an intuitive way to fit Muguruza’s current run into the discussion. And let’s face it, 20 is just as arbitrary as 22.

Out of my entire database on women’s tennis results going back to 1950 or so, about 100 women have enjoyed a 22-match run that outscores Muguruza’s best. The top of the list is the end of Navratilova’s 1983 season, which is worth a yElo of 2445. Close behind is Monica Seles, who reached 2438 with a streak starting at the end of 1992 and extending into the 1993 season. Three more women topped 2400, another 27 exceeded 2300, and 46 more put together 22 consecutive matches worth at least 2200.

Here are the 15 active women who’ve played at least as well as Muguruza for their best 22-match spans:

yElo  Player                W-L   Year(s)  
2389  Serena Williams       21-1  2001-02  
2386  Venus Williams        22-0  2000     
2335  Kim Clijsters         20-2  2002-03  
2332  Victoria Azarenka     22-0  2012     
2234  Vera Zvonareva        18-4  2008     
2217  Svetlana Kuznetsova   19-3  2004     
2217  Naomi Osaka           20-2  2019-20  
2209  Samantha Stosur       20-2  2010     
2205  Petra Kvitova         19-3  2011-12  
2205  Simona Halep          20-2  2018     
2196  Caroline Garcia       18-4  2017     
2186  Ashleigh Barty        19-3  2019     
2180  Angelique Kerber      18-4  2015-16  
2174  Carla Suarez Navarro  18-4  2015     
2172  Garbine Muguruza      17-5  2015

With the caveat that I haven’t spent much of my life thinking about the best 22-match runs in women’s tennis history, this seems like a credible list. I particularly like how yElo manages to consider strength of opponent to the point that an 18-4 run*, like Zvonareva’s in 2008, can outrank so many 20-2s. (Vera even beats a few 22-0s from the amateur era.)

* the link shows a few extra matches–the 18-4 run starts in the QFs of Guangzhou and ends in the Tour Finals semi-final. Note again that yElo skips retirements.

I hope you find the new yElo metric as interesting as I do. I’ll definitely be doing more with it, since I suspect it has value even outside the narrow context of one player and a single timespan of arbitrary lenth.

Repurposing Elo for Streaks, Seasons, and Garbine Muguruza

Elo is a fantastic tool for its explicit purpose: estimating the skill level of players based on available information. For instance, my WTA ratings currently rank Ashleigh Barty second. That seems plausible enough–it may be correct to give her the edge in a head-to-head matchup with everyone on tour except for Naomi Osaka. But with women pursuing such different schedules this season, a rating is only so useful.

For all of Barty’s or Osaka’s skill, is it right to say either one of them has had a better 2021 season than Garbine Muguruza? Osaka won the Australian Open, so she has a valid claim. Barty’s argument is a lot more tenuous, based on only eight victories. The Spaniard’s case writes itself–only a handful of players are up to double digits in wins this year, and Muguruza already has 18. How could we decide? If Elo is the smart version of the official rankings, what’s the smart version of the official race?

Starting fresh

The Elo algorithm itself offers a solution. A big part of the reason Muguruza is rated 4th on my current Elo list–and not higher–is her career before 2021. We had hundreds of matches worth of data on Garbine before January 1st, and it would be silly to throw all that away. Her 18-4 start is fantastic, but it doesn’t supersede everything that came before. It just gives us reason to update our rating.

Here’s where the ranking/race analogy is useful. The official rankings use a time span of 52 weeks (or more). The race restarts on January 1st. We could do the exact same thing with Elo, throwing away all results from the previous year and starting over, but that would be wasteful–it wouldn’t allow us to take into account whether players had faced particularly easy or tough draws, for instance.

The solution is to set Elo ratings back to zero (or 1500, in Elo parlance) one player at a time.

Take Muguruza. Instead of starting the year with a rating of 1981 and a history of several hundred matches, we pretend to know nothing about her. We give her a newbie’s rating of 1500 and a history of zero matches. Then we run the Elo algorithm to update her rating over the course of her 22 matches. First she faces Kristina Mladenovic (with her actual rating at the time of 1817), and improves to 1605. Then she beats Aliaksandra Sasnovich (and her rating of 1805), and improves to 1692. Repeat for each of her 2021 results, and the end result is a rating of 2160–almost 100 points higher than her current “real Elo” rating and within shouting distance of Osaka’s 2189.

To compare players, work through the same steps for everybody else, calculating their current-season rating as if they played their first career match in January.

It’s worth taking a moment to think about exactly what we’re measuring. That outstanding 2160 rating is what you get if a complete unknown shows up with zero match experience, then goes on the 22-match run that has been Muguruza’s season so far. The difference between real-Garbine and fake-newbie-Garbine is that the real one has an extensive track record that tells us she’s always been good–but that she probably isn’t quite this good.

I call it … yElo

This approach is “Elo for seasons” or “year Elo”–yElo*. It doesn’t have to be limited to calendar years, as the same approach would be useful to comparing, say, 20-match segments. It allows us to take advantage of the Elo algorithm–and the well-informed ratings of other players–to measure partial careers.

* you can pronounce it like the color “yellow,” but I prefer to say it like Phil Dunphy from Modern Family answering the phone.

Muguruza’s 2160 rating sure looks good, so how does it stack up against the rest of the tour? Here’s the 2021 top 20, considering players with at least five match wins through the Dubai and Guadalajara finals last weekend:

Rank  Player                W-L  yElo  
1     Garbine Muguruza     18-4  2160  
2     Naomi Osaka          10-0  2094  
3     Jessica Pegula       15-5  2002  
4     Serena Williams       8-1  1997  
5     Elise Mertens        11-2  1971  
6     Karolina Muchova      7-1  1953  
7     Aryna Sabalenka      11-4  1943  
8     Iga Swiatek          10-3  1941  
9     Daria Kasatkina      10-4  1910  
10    Barbora Krejcikova   10-5  1905  
11    Shelby Rogers         9-4  1902  
12    Jil Teichmann         9-5  1899  
13    Anett Kontaveit       9-4  1897  
14    Jennifer Brady        9-4  1892  
15    Cori Gauff           11-5  1885  
16    Danielle Collins      9-4  1883  
17    Ashleigh Barty        8-2  1878  
18    Sara Sorribes Tormo   9-2  1867  
19    Ann Li                5-1  1864  
20    Simona Halep          6-2  1854 

Like any Race list in March, this isn’t really reflective of skill. But when we consider the small amount of data it has to work with for each player, it’s … pretty good?

Again, you can quibble over whether Osaka or Muguruza has had the better season, but this approach weighs the better winning percentage and stronger average opponent against the much higher absolute win count and gives us a credible answer. Muguruza’s additional evidence of good tennis playing puts her ahead of Osaka’s evidence of short-term unbeatability.

While yElo is basically just a toy–it certainly doesn’t have the same predictive value as regular Elo–this initial look makes me like it. The possibilities are endless, from more sophisticated race tracking, to ranking the greatest seasons of all time, to comparing a player’s current hot streak to what’s she’s done in the past. Stay tuned, as I’m sure I’ll have more yElo results to report in the future.

Houston and the Swarm of American Men

Italian translation at settesei.it

Of the 28 men in the ATP Houston main draw this week, 15 have a “USA” next to their names. The Americans include three of the top four seeds (John Isner, Sam Querrey, and Jack Sock), two of the four qualifiers (Stefan Kozlov and Denis Kudla) and one of the three wild cards (Mackenzie McDonald). The home-country dominance at the US Clay Court Championships hearkens back to earlier eras of professional tennis, when a few countries–the USA often first among them–dominated the ranks.

Those days are long gone, but this week’s turnout in Texas is the latest sign of an American resurgence. Sure, many top players are taking the week off, and plenty of European contenders opted for a similarly valuable event in Marrakech, so US players hardly represent half of the best ATPers. But 15 of 28–a main draw made up of such a high percentage of USAs–is something the tennis world hasn’t seen in a long time.

Going back five decades, there have been just over 400 ATP-level tournaments in which one country represented more than half of main draw entrants–an average of about eight events per year. The average is misleading, though: Houston is the first time it has happened since 2004, and there are only two previous instances in the last two decades. To find another draw so packed with Americans, we need to go back to 1996. Here are the last 20 tournaments in which one country represented more than half of main draw players:

Date      Tourney         Draw  Country  Count      %  
20040412  Valencia        32    ESP         20  62.5%  
19990913  Mallorca        32    ESP         18  56.3%  
19970908  Marbella        32    ESP         18  56.3%  
19960930  Marbella        32    ESP         18  56.3%  
19960212  San Jose        32    USA         17  53.1%  
19951002  Valencia        32    ESP         18  56.3%  
19950206  San Jose        32    USA         18  56.3%  
19940214  Philadelphia    32    USA         18  56.3%  
19940131  San Jose        32    USA         17  53.1%  
19930802  Los Angeles     32    USA         17  53.1%  
19930201  San Francisco   32    USA         19  59.4%  
19920803  Los Angeles     32    USA         17  53.1%  
19910708  Newport         32    USA         17  53.1%  
19910506  Charlotte       32    USA         17  53.1%  
19910401  Orlando         32    USA         20  62.5%  
19900730  Los Angeles     32    USA         19  59.4%  
19900507  Kiawah Island   32    USA         24  75.0%  
19900402  Orlando         32    USA         17  53.1%  
19900219  Philadelphia    48    USA         27  56.3%  
19900212  Toronto Indoor  56    USA         30  53.6%

The four most recent tournaments took place in three different places, but were instances of the same event. The rest of the draws on this list suggest just how many good tennis players were produced in that era by the United States. In about 85% of the tournaments in which one country made up half or more of the field, the dominant nation was the USA. Australia accounts for another 50, all at tournaments in Oz, most of them before 1980. The US is the only country to fill up more than half of a draw outside of its own borders.

What makes this week’s feat in Houston even more remarkable is that the tournament’s organizers gave only one of the three wild cards to a local player. (The other two went to 4th seed Nick Kyrgios, who didn’t bother to enter via conventional means, and fan favorite Dustin Brown.) In other words, Americans would have accounted for half of the draw even without the aid of wild cards.

This more specialized feat–non-wild cards from one country accounting for half of the draw–is even rarer over the last 25 years or so. Of the 20 tournaments listed above, only nine met this more rigorous standard. The other 11 only cleared the bar with the aid of wild cards. The 2004 Valencia tournament still qualifies, but for the most recent instance on American soil, we need to go back more than 25 years, to the 1993 event in San Francisco. That tourney had good reason to retain at least one wild card for a foreigner, as the organizers managed to attract Bjorn Borg. Borg lost in the first round, and Andre Agassi took the championship with a final-round win over Brad Gilbert.

It remains to be seen whether the sheer force of numbers will be enough to keep the Houston title in American hands. (Steve Johnson, the sixth seed this week, won it last year.) Of the 400-plus events with more than half of players representing the same flag, the winner has come from that dominant country about 73% of the time. My model suggests it is a toss-up this week, with a 48.9% probability that a US player wins it all. One of the favorites, however, is Australian Nick Kyrgios, with nearly a 45% chance of winning himself. One dark horse is the most interesting of all: Fifth seed Fernando Verdasco won this event four years ago. And fourteen years ago in Valencia, the last time one country made up more than half of an ATP draw, Verdasco was the man who hoisted the trophy.

Fun With Service Point Ratios

Italian translation at settesei.it

In Rafael Nadal’s comprehensive victory over Kevin Anderson in the 2017 US Open final, Nadal didn’t face a single break point. Anderson didn’t even earn very many deuces. Nadal, on the other hand, constantly challenged in his opponent’s service games.

This produced an unusual ratio: Anderson had to play way more service points than Nadal did, even though they served the same number of games. Rafa toed the line only 72 times to the South African’s 108, for a ratio of 2/3 or, rounded, 0.67. In this week’s podcast, I speculated that this service point ratio is a handy way of spotting winners–if one man is getting through his service games much quicker than the other, it’s probably because he is holding easily and his opponent is not.

It wasn’t the best hypothesis I’ve ever put forward. It’s true, but not by an overwhelming margin. In the average ATP match, the ratio of the winner’s service points played to the loser’s service points played is 0.96 — equivalent to Rafa serving 88 times to Anderson’s 92. The winnner plays fewer service points in 57% of contests. We’ve hardly discovered the next IBM Key to the Match here.

Instead of discovering a useful proxy for success in the most basic of match stats, we’ve come upon yet another item to add to the list of Nadal’s extreme accomplishments. Of nearly 13,000 completed grand slam singles matches since 1991, only 147 of the winners–barely one percent–had service point ratios below 0.67. Out of 106 major finals with stats available, Rafa’s ratio on Sunday was the lowest on record. He just edged out Roger Federer‘s 0.68 ratio from the 2007 Australian Open final against Fernando Gonzalez.

It turns out that the service point ratio is as fluky for Rafa as it is for men as a whole. Of his 16 victories in grand slam finals, he has posted a ratio below 1.0 in eight of them, equal to 1.0 once, and above 1.0 seven times. His average is an uninteresting 0.98.

There you have it: Over the course of a single week, we’ve seen an oddity, devised a stat to capture it, and determined that it doesn’t tell us much. Analytics, anyone?

For a more serious look at Rafa’s career accomplishments after bringing home his 16th major title, check out my analysis posted yesterday at The Economist’s Game theory blog.

Stanislas Wawrinka and Hanging With the Top Ten

Only three ATP players this year have won more than five matches against top-ten-ranked opponents: Rafael Nadal (20), Novak Djokovic (18), and Stanislas Wawrinka (7).  It’s a good single-stat representation of Stan’s great year, as the Swiss had only won 18 matches against top-ten opponents in the previous eight seasons, including a painful 2-11 showing last year.

Wawrinka’s ability to play at the level of the very best players makes one wonder if he will move even higher in the rankings next year.  Is it possible that players who amass so many top-ten victories are slated for bigger and better things?

Certainly, seven top-ten wins in a season is no mean accomplishment.  Andy Roddick finished the 2003 season as World #1 with only six such wins, and Nadal ascended to #2 in 2005 with only five top-ten wins.  Since 1991, 25 players have finished a season in the top five while winning fewer matches against top-ten opponents than Wawrinka did this year.  And of course, with at least three matches against top-flight opponents this week, Stan might not be done.

On the other hand, tallying a bunch of victories against top-ten opponents doesn’t always predict further success.  Since 1991, 42 players have won at least seven such matches while finishing outside the top five.  Of those, only 12 improved their overall winning percentage the next year.  On average, those players saw their overall winning percentages drop eight percent.

One particularly bizarre precedent for Stan’s top-ten success is Vince Spadea‘s 1999 campaign.  While he barely broke even on the season, winning 33 of 60 matches, eight of those wins were against top-ten opponents, including Pete Sampras, Andre Agassi, and Yevgeny Kafelnikov (twice!).  The next year, he lost his first sixteen matches in a row and tallied only three tour-level wins–against anyone.

There are a few extreme examples in the other direction.  Sampras went 8-7 against top-ten opponents in 1991, finishing the year at #6.  He continued his climb into the tennis stratosphere the following season.  19-year-old Lleyton Hewitt won 10 of 16 top-ten matches in 2000 en route to a #7 ranking.  A year later, he was #1 in the world.  And for a case even closer to home for Wawrinka, a young man named Roger won 10 matches against top-ten opponents in 2002, finishing the year at #6.  It would be a long time before his ranking returned to such a low point.

Of course, Pete, Lleyton, and Roger were youngsters on their way up.  No matter how distended the ATP aging curve becomes, it’s safe to assume that Wawrinka is not at an equivalent stage of his career.

It’s a familiar story with tennis statistics.  Wawrinka has a great season, so we look for the reason why.  (Top-ten wins? Improved second-serve win percentage? Better tiebreak win percentage?) It’s easy to find numbers that show us what worked this year, much more difficult to convincingly explain why.  It’s more difficult still to support a conviction that the player has “turned a corner” and we can expect more of this high-quality play from him next year.

Top-ten win tallies like Wawrinka’s aren’t any better at picking future winners than tiebreak records like his 17-12 mark are.  It’s no more than a fun stat and a useful marker of a solid year.  But don’t fret, Stan fans, it doesn’t make a coherent case for a decline, either.  Stan may well be a top-ten mainstay for the next few years–after all, somebody’s got to be.

Winning Matches With Very Few Return Points

Yesterday in Paris, Gilles Simon won the first set of his match over Nicolas Mahut (a.k.a. Nicolas Massu), doing so with the benefit of a single break.  That’s not unusual, but his return performance in the set was.  He won only four return points in the entire set–all, of course, in that single game.

It’s possible to win a set while claiming only one return point, if you reach a tiebreak and win every point on your own serve.  In theory, then, a player could win a best-of-three-set match while winning only two return points, or a best-of-five with only three.  If no sets reach tiebreaks, a player could win a match with as few as four return points per set, as Simon did in the first set yesterday.

In the last 20-plus years of ATP tour-level matches, no one has ever posted such an extreme win, winning only two return points (or even eight return points in a match with no tiebreaks) en route to victory.  But on several occasions, players have come close.

Since 1991, six players have won matches while winning only ten return points.  The most recent was Philipp Kohlschreiber‘s 6-4 7-6(4) victory over Jonathan Dasnieres de Veigy at the 2011 Metz tournament.

More impressive, though, was Albert Montanes‘s 2002 victory over Felix Mantilla in Acapulco.  He won 6-4 6-4 with only ten return points won, meaning that he “wasted” only two of those return points.  Mantilla had ten service games, lost two them, and held to love in at least six of the others.

Record-setting in their own way are two more of these ten-return-point matches: Irakli Labadze d. Justin Gimelstob 6-7(2) 7-6(3) 6-2 (2001 Shanghai) and Gustavo Kuerten d. Marat Safin 3-6 7-6(2) 7-6(2) (2000 Indianapolis).  These are the three-set matches in which the winner claimed the fewest return points.  It’s possible that Labadze and Kuerten didn’t win a single return point in the sets they lost, but it makes their eventual victory all the more impressive.

The Labadze win is also notable in that it is the only ten-return-points-won match in which the winner won a double-break set.  The Kuerten victory points in a new direction: Safin hit two double faults, so of the ten return points Kuerten won, he only had to make an effort on eight of them.

Remarkably, that’s not quite the record.  At 1992 Queen’s Club, Shuzo Matsuoka beat Goran Ivanisevic 6-4 6-3 while winning just 12 return points.  Five of those were Ivanisevic double faults, so Matsuoka only won seven points in which he returned the big Croatian’s serve.

One more bit of trivia.  At last year’s US Open, Milos Raonic beat Paul Henri Mathieu 7-5 6-4 7-6(4) while tallying only 16 return points (two of which were PHM double faults).  That’s the record for best-of-five-set matches, just barely edging out Jurgen Melzer‘s 2007 victory in Australia over Ivo Karlovic, 6-4 6-4 7-6(6), in which he won only 17 return points (three of them doubles).

Dr. Ivo, as you might guess, has piled up more than his share of this sort of match.  In fact, he has played 65 matches in his career in which the winner won fewer than 20 return points, amassing a nearly even record of 33 wins and 32 losses.  That impressive total puts him in second place among ATPers of the last 23 years, behind Andy Roddick.  Roddick played 69 such matches, winning 54 against only 15 losses.  Fittingly, Roddick and Karlovic played two of those matches against each other … and the American won both.

Daniel Brands and Ace Records in Context

In the Vienna round of 16 last week, Juan Martin Del Potro beat Daniel Brands in a three-set, three-tiebreak match.  The courts are fast, Delpo serves big, and apparently Brands has quite the weapon of his own, as both players hit at least 30 aces.  Brands hit 32.

We can’t help but be impressed at the sheer numbers.  As it turns out, it’s an ATP first, at least since 1991, when the ATP started keeping such stats.  Never before had both players hit at least 30 aces in a three-set match.

Here are the top nine matches in the ATP record books, in which both servers reached a certain ace milestone:

minAces  Winner                 Loser              Year  Event               Surface  Score                 wAces  lAces  
30       Juan Martin Del Potro  Daniel Brands      2012  Vienna              Hard     6-7(5) 7-6(4) 7-6(6)     30     32  
29       John Isner             Gilles Muller      2010  Atlanta             Hard     4-6 7-6(6) 7-6(7)        33     29  
28       Andrei Pavel           Gregory Carraz     2005  Milan               Carpet   7-6(0) 6-7(5) 7-6(3)     28     33  
25       Greg Rusedski          Joachim Johansson  2004  Moscow              Carpet   7-6(5) 6-7(1) 7-6(7)     25     26  
25       Arnaud Clement         Thomas Johansson   2008  Cincinnati Masters  Hard     7-6(4) 6-7(5) 6-3        25     28  
24       Mark Philippoussis     Greg Rusedski      2002  Queen's Club        Grass    6-7(1) 7-6(3) 7-6(5)     25     24  
24       Joachim Johansson      Kristof Vliegen    2006  Stockholm           Hard     6-7(5) 7-6(5) 7-6(7)     24     24  
24       Andy Roddick           Ivo Karlovic       2009  Queen's Club        Grass    7-6(4) 7-6(5)            24     26  
24       Richard Gasquet        Joachim Johansson  2009  Kuala Lumpur        Hard     4-6 7-6(1) 6-2           26     24

(There are several matches in which both players hit 23, including two on clay, both from 2011: Isner/Karlovic in Houston, and Federer/Feliciano Lopez in Madrid.  Both went to three tiebreaks.)

Aces in a losing effort

Even independent of Del Potro’s 30 aces, it stands out that Brands racked up 32 aces in a best-of-three losing effort.  But that’s not a record–it ties him for 16th of all time with several others, including Sam Querrey, Milos Raonic, Ivo Karlovic, and Goran Ivanisevic, who did it twice.

Mardy Fish may not be proud of this record, but he simply blows away the rest of the field, having served past the eminently ace-able Olivier Rochus 43 times despite losing to the Belgian.  Though Karlovic may not sit atop the list, he makes up for it by dominating the middle.

lAces  Winner              Loser             Year  Event             Surface  Score                  wAces  
43     Olivier Rochus      Mardy Fish        2007  Lyon              Carpet   6-7(5) 7-6(6) 7-6(15)      2  
37     Yevgeny Kafelnikov  Alexander Waske   2002  Tashkent          Hard     6-7(6) 7-6(5) 7-6(6)      10  
35     Pete Sampras        Goran Ivanisevic  1996  Tour Finals       Carpet   6-7(6) 7-6(4) 7-5         17  
35     Andy Roddick        Feliciano Lopez   2011  Queen's Club      Grass    7-6(2) 6-7(5) 6-4         15  
35     Feliciano Lopez     Ivo Karlovic      2004  Madrid Masters    Hard     6-4 6-7(10) 7-6(5)         8  
35     Yen Hsun Lu         Ivo Karlovic      2012  Queen's Club      Grass    6-7(3) 7-6(6) 7-6(7)       6  
35     Rafael Nadal        Ivo Karlovic      2008  Queen's Club      Grass    6-7(5) 7-6(5) 7-6(4)       6  
35     Arnaud Clement      Ivo Karlovic      2004  's-Hertogenbosch  Grass    7-6(8) 6-7(5) 6-3          2  
34     Thomas Johansson    Ivan Ljubicic     2002  Canada Masters    Hard     4-6 6-4 7-6(6)            17  
34     Lars Burgsmuller    Wayne Arthurs     2006  Tokyo             Hard     6-7(5) 7-6(7) 7-6(3)      10  
34     Richey Reneberg     Richard Krajicek  1997  Halle             Grass    4-6 7-6(2) 7-6(6)          6

Total aces in a single match

If there has never been a match in which both players hit 30 aces, a match total of 62 aces must be pretty impressive, right?

Indeed it is.  Del Potro and Brands are now tied for the record, initially set by John Isner and Gilles Muller two years ago in Atlanta.  It’s only the fourth time that two players have combined for 60 or more aces in a best-of-three contest.

totAces  Winner                 Loser             Year  Event               Surface  Score                 wAces  lAces  
62       Juan Martin Del Potro  Daniel Brands     2012  Vienna              Hard     6-7(5) 7-6(4) 7-6(6)     30     32  
62       John Isner             Gilles Muller     2010  Atlanta             Hard     4-6 7-6(6) 7-6(7)        33     29  
61       Andrei Pavel           Gregory Carraz    2005  Milan               Carpet   7-6(0) 6-7(5) 7-6(3)     28     33  
60       Goran Ivanisevic       Magnus Norman     1997  Zagreb              Carpet   7-6(5) 6-7(4) 7-5        40     20  
58       Frank Dancevic         Peter Wessels     2007  Stockholm           Hard     6-1 6-7(7) 7-6(6)        35     23  
55       Jan Michael Gambill    Wayne Arthurs     2002  San Jose            Hard     7-5 6-7(5) 7-6(4)        22     33  
55       Bohdan Ulihrach        Goran Ivanisevic  1999  Rotterdam           Carpet   6-7(6) 7-6(3) 7-5        23     32  
53       Andy Roddick           Wayne Arthurs     2006  Memphis             Hard     6-7(4) 7-6(9) 7-6(2)     20     33  
53       Andy Roddick           Sam Querrey       2010  San Jose            Hard     2-6 7-6(5) 7-6(4)        21     32  
53       Arnaud Clement         Thomas Johansson  2008  Cincinnati Masters  Hard     7-6(4) 6-7(5) 6-3        25     28  
53       Joachim Johansson      Gregory Carraz    2004  Canada Masters      Hard     7-6(4) 6-7(3) 7-6(4)     30     23

The higher bar of ace rate

If you want to set a record in a best-of-three-sets match, getting to those three tiebreaks is a good idea.  The more points you play, the more likely you’ll hit more aces, as evidenced by Fish’s losing performance, where he not only reached three tiebreaks, but played at least twelve points in each one!

For greater context, we should open up the field to all matches regardless of length, and compare them by ace rate.

Del Potro’s 30 aces came in 125 service points, for an ace rate of 24%.  Brands hit 32 in 131, for an ace ate of 24.4%.  It’s not often that one player (not named Isner, anyway) hits nearly one-quarter of his serves for aces, so it is particularly unusual for both players to do so.

In all tour-level matches (including grand slams) since 1991, a minimum ace rate of 24.0% is only good for 17th.  Andy Roddick was particularly adept at bringing about these kinds of matches, appearing in 6 of the top 11 on this list:

minA%  Winner            Loser              Year  Event            Surface  Score                wA%    lA%  
33.3%  Andy Roddick      Ivo Karlovic       2009  Queen's Club     Grass    7-6(4) 7-6(5)      33.3%  35.1%  
29.8%  Mikhail Youzhny   Ivan Ljubicic      2007  Rotterdam        Hard     6-2 6-4            29.8%  29.8%  
29.2%  Gregory Carraz    Martin Verkerk     2004  Milan            Carpet   6-3 7-6(3)         30.4%  29.2%  
27.3%  Goran Ivanisevic  Boris Becker       1996  Antwerp          Carpet   6-4 7-6(5)         30.8%  27.3%  
27.1%  John Isner        Gilles Muller      2010  Atlanta          Hard     4-6 7-6(6) 7-6(7)  27.5%  27.1%  
27.0%  Robin Soderling   Andy Roddick       2008  Lyon             Carpet   7-6(5) 7-6(5)      27.0%  27.2%  
26.7%  Janko Tipsarevic  Peter Luczak       2010  s-Hertogenbosch  Grass    6-3 6-3            26.7%  27.1%  
26.1%  Andy Roddick      Gilles Muller      2008  Memphis          Hard     6-4 7-6(4)         27.4%  26.1%  
25.4%  Andy Roddick      Joachim Johansson  2004  San Jose         Hard     6-3 7-6(7)         36.5%  25.4%  
25.4%  Andy Roddick      Nicolas Mahut      2008  Lyon             Carpet   7-6(5) 6-4         29.0%  25.4%  
25.3%  Andy Roddick      Feliciano Lopez    2008  Dubai            Hard     6-7(8) 6-4 6-2     26.2%  25.3%

Ace rate in a losing effort

While losers rarely hit as many aces as Brands did last week, losers often hit aces at a much higher rate.  Brands doesn’t register anywhere near the top of this all-time list.

Think of it this way: The shorter the match, the more likely a player will do something off-the-charts, rate-wise.  Karlovic tops this list, with 28 aces in his 70 service points.  Brands didn’t maintain anywhere near the same rate that Ivo did, but Brands did have to hit nearly twice as many serves!  Had Karlovic continued for 61 more serves, he probably would’ve done better than 24.4%, but it is very unlikely he would have continued at a 4-in-10 pace.

This is also a reason why we haven’t seen many best-of-five matches on the ace-rate leaderboards.  Even if one player is acing like a madman while quickly losing, he still has to keep up the pace for three sets.

lA%    Winner              Loser               Year  Event               Surface  Score                     lAces  
40.0%  Florent Serra       Ivo Karlovic        2009  Basel               Hard     7-6(5) 6-4                   28  
37.5%  Alex Obrien         Mark Philippoussis  1996  Cincinnati Masters  Hard     6-4 6-4                      21  
36.6%  Thomas Johansson    Ivan Ljubicic       2002  Canada Masters      Hard     4-6 6-4 7-6(6)               34  
35.8%  Richey Reneberg     Richard Krajicek    1997  Halle               Grass    4-6 7-6(2) 7-6(6)            34  
35.1%  Andy Roddick        Ivo Karlovic        2009  Queen's Club        Grass    7-6(4) 7-6(5)                26  
34.8%  Paul Henri Mathieu  Ivo Karlovic        2009  Cincinnati Masters  Hard     7-6(9) 6-4                   23  
34.8%  Paul Henri Mathieu  Chris Guccione      2008  Adelaide            Hard     4-6 6-3 6-4                  24  
34.2%  Andre Agassi        Joachim Johansson   2005  Australian Open     Hard     6-7(4) 7-6(5) 7-6(3) 6-4     51  
33.8%  Jonas Bjorkman      Mark Philippoussis  2002  Memphis             Hard     7-6(6) 7-6(1)                26  
33.3%  Thomas Johansson    Wayne Arthurs       2001  Nottingham          Grass    7-6(3) 7-6(3)                24  
33.3%  Yevgeny Kafelnikov  Marc Rosset         2002  Marseille           Hard     6-3 7-6(5)                   19  
33.3%  Andre Agassi        Goran Ivanisevic    1994  Vienna              Carpet   6-4 6-4                      19

Combined ace rate

As you might have guessed by now, 24% isn’t going to be good enough to crack this final all-time list.  Roddick, Karlovic, and Mark Philippousis simply played too many matches to allow that to happen.

Indeed, the Brands/Del Potro combined rate of 24.2% isn’t even close to the top of this list.  To show up here, it’s necessary to come within an ace or two of the 30% mark.  With Andy’s retirement and Ivo’s decline, this leaderboard looks particularly safe at the moment.

totA%  Winner              Loser              Year  Event                 Surface  Score          totAces    wA%    lA%  
34.2%  Andy Roddick        Ivo Karlovic       2009  Queen's Club          Grass    7-6(4) 7-6(5)       50  33.3%  35.1%  
31.6%  Andy Roddick        Thomas Johansson   2004  Bangkok               Hard     6-3 6-4             31  38.2%  23.3%  
31.6%  Andy Roddick        Joachim Johansson  2004  San Jose              Hard     6-3 7-6(7)          42  36.5%  25.4%  
31.6%  Martin Verkerk      Thomas Enqvist     2003  Milan                 Carpet   6-3 6-4             30  46.0%  15.6%  
30.6%  Robin Soderling     Gregory Carraz     2004  Marseille             Hard     6-3 6-4             30  42.6%  19.6%  
30.4%  Jonathan Stark      Goran Ivanisevic   1997  Indian Wells Masters  Hard     7-5 6-3             34  37.7%  23.7%  
29.9%  Mark Philippoussis  Lionel Roux        1996  Paris Masters         Carpet   6-4 6-4             35  49.1%  11.7%  
29.8%  Mikhail Youzhny     Ivan Ljubicic      2007  Rotterdam             Hard     6-2 6-4             28  29.8%  29.8%  
29.8%  Gregory Carraz      Martin Verkerk     2004  Milan                 Carpet   6-3 7-6(3)          36  30.4%  29.2%  
29.0%  Jonathan Stark      Thomas Enqvist     1993  Halle                 Grass    6-4 6-2             27  37.8%  20.8%  
29.0%  Goran Ivanisevic    Boris Becker       1996  Antwerp               Carpet   6-4 7-6(5)          38  30.8%  27.3%

Andy, we’re missing you already.