Also: Arina Rodionova (probably) in the top 100
Fifteen break points. A week has passed, a new champion has been crowned, and I still can’t stop thinking about it. In the first two sets of his Australian Open quarter-final match against Taylor Fritz, Novak Djokovic failed to convert fifteen straight break points.
It’s so far out of character as to defy belief. Djokovic has converted more than 40% of his break chances in the past year, even counting the 4-for-21 showing in the entire Fritz match. The American, one of the better servers on tour, typically saves only two-thirds of the break points he faces. The chances that Novak would come up short 15 times in a row are about one in seven million.
Even stranger, it wasn’t because Fritz served so well. He missed his first serve on 7 of the 15 break points. He hit two aces and another four didn’t come back, but that leaves nine rallies when–under pressure, in Australia–Taylor Fritz beat Novak Djokovic. Five of those lasted at least seven strokes, including a 25-shot gutbuster at 4-3 in the second set that was followed, two points later, by yet another Fritz winner on the 17th shot. All credit to the American, who walked a tightrope of down-the-line backhands and refused to give in to an opponent who, even in the first two sets, was outplaying him. But clearly this wasn’t a matter of Fritz intimidating or otherwise imposing himself on Novak.
There’s no shortage of explanations. Djokovic is recovering from a wrist injury that hampered him in his United Cup loss to Alex de Minaur. He apparently had the flu going into the Melbourne semi against Jannik Sinner. The whole Australian adventure might be nothing more than a health-marred aberration; in this interpretation, none of Jiri Lehecka, Dino Prizmic, Alexei Popyrin, or even Fritz would otherwise have taken a set from the all-time great.
But… the man is 36 years old. If other tennis players his age are any guide, he may never be fully healthy again. He will continue to get slower, if only marginally so. He personally raised the physical demands of the sport, and finally, a younger generation has accepted the challenge. Djokovic has defied the odds to stay on top for as long as he has, but eventually he will fade, even if that means only a gentle tumble out of the top three. After a month like this, we have to ask, is it the beginning of the end?
Rally intolerance
The two marathon break points that Fritz saved were not exceptions. 64 of the 269 points in the quarter-final reached a seventh shot, and the American won more than half of them. Even among double-digit rallies, the results were roughly even.
Here’s another data point: Djokovic fought out 53 points in his first-rounder against Prizmic that reached ten shots or more. The 18-year-old Croatian won 30 of them. Yeah, Prizmic is a rising star with mountains of potential, but he’s also ranked 169th in the world. This is not the Novak we’ve learned to expect: Even after retooling his game around a bigger serve and shorter points, he remained unshakeable from the baseline, his famous flexibility keeping him in position to put one more ball back in play.
Down Under, though, those skills went missing. Based on 278 charted matches since the start of 2015, the following table shows the percentage of points each year that he takes to seven shots or more, and his success rate in those rallies:
Year  7+ Freq  7+ Win%
2015    23.3%    54.9%
2016    26.7%    53.1%
2017    29.1%    53.3%
2018    24.4%    52.6%
2019    25.0%    55.1%
2020    26.0%    54.3%
2021    23.8%    53.6%
2022    23.2%    54.7%
2023    23.4%    54.1%
2024    26.0%    49.8%
By the standards of tennis’s small margins, that’s what it looks like to fall off a cliff. The situation probably isn’t quite so bad: The sample from 2024 is limited to only the matches against Lehecka, de Minaur, Prizmic, Fritz, and Sinner. On the other hand, matches charted in previous years also skew in favor of novelty, so upsets, close matches, and elite opponents are overrepresented there too.
It is especially unusual for Djokovic to see such a decline on hard courts. Over the last decade, he has gone through spells when he loses more long rallies than he wins. But they typically come on clay. Carlos Alcaraz shut him down in last year’s Wimbledon final as well, winning 57% of points that reached the seventh shot and 63% of those with ten or more strokes. The only period when hard-court Novak consistently failed to win this category was late 2021, when Medvedev beat him for the US Open title (and then outscored him in long rallies in Paris), and Alexander Zverev won 62% of the seven-plusses (and 70% of ten-plusses!) to knock him out of the Tour Finals.
Protracted rallies are a young man’s game, and Djokovic’s results are starting to show it. Before dissecting Alcaraz in Turin last November, Novak had never won more than half of seven-plusses against Carlitos. He has barely held on against Sinner, winning 43% of those points in their Tour Finals round-robin match and 51% at the Davis Cup Finals. In 13 meetings since 2019, Medvedev has won more of these long rallies than Djokovic has. Zverev, too, has edged him out in this category since the end of 2018.
Against the rest of the pack, Djokovic manages just fine. He dominates seven-plusses against Casper Ruud and Stefanos Tsitsipas, for instance. But it’s one of the few chinks in his armor against the best, and if January represents anything more than the temporary struggles of an ailing star, more players are figuring out how to take advantage.
Avoiding danger
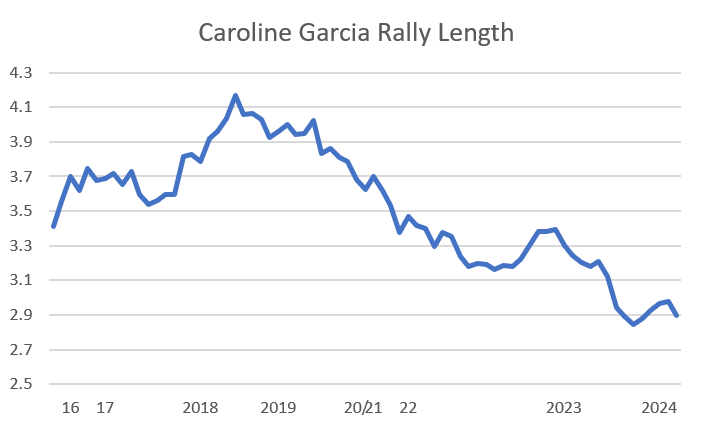
For players who lose a disproportionate number of long points, the best solution is to shorten them. Djokovic may never have thought in exactly those terms, but perhaps with an eye toward energy conservation, he has done exactly that.
Especially from 2017 to 2022, Novak drastically reduced the number of points that reached the seven-shot threshold:
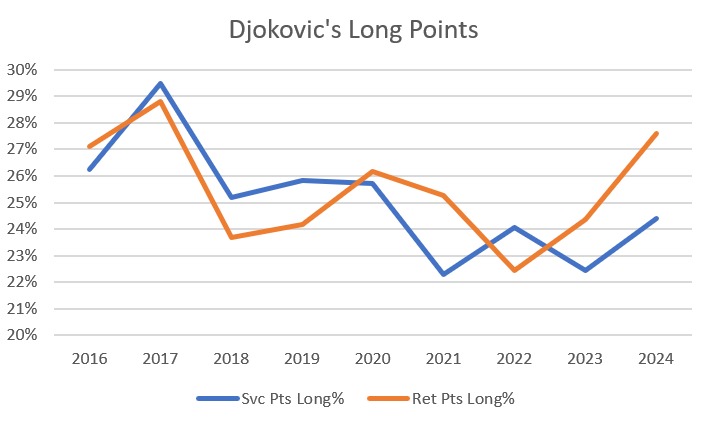
In 2017, 29% of his points went that long; in 2022 and 2023, barely 23% did. It remains to be seen whether January 2024 is more than a blip. In his up-and-down month, Novak remained able to control his service points, but he was less successful avoiding the grind on return. As we’ve seen, that’s dangerous territory: Djokovic won a healthy majority of the short points against Fritz but was less successful in the long ones, especially following the American’s own serve.
Much rests on the direction of these trends. If the players Djokovic has faced so far this year can prevent him from finishing points early, how will he handle Medvedev or Zverev?. If Novak can’t reliably outlast the likes of Fritz and Prizmic, what are his chances against Alcaraz?
Djokovic is well-positioned to hold on to his number one ranking until the French Open, when he’ll be 37 years old. By then, presumably, he’ll be clear of the ailments that held him back in Australia. Still, holding off the combination of Sinner, Alcaraz, Medvedev, Zverev, and Father Time will be increasingly difficult. The 24-time major champion will need to redouble the tactical effort to keep points short and somehow recover the magic that once made him so implacable in the longest rallies. Age is just a number, but few metrics are so ruthless in determining an athlete’s fate.
* * *
Arina Rodionova on the cusp of the top 100
In December, Australian veteran Arina Rodionova celebrated her 34th birthday. Now she’s competing at the tour-level event in Hua Hin this week, sporting a new career-best ranking of 101. With a first-round upset win over sixth-seed Yue Yuan, she’s up to 99th in the live rankings. Her exact position next Monday is still to be determined–a few other women could spoil the party with deep runs, or she could climb higher with more victories of her own–but a top-100 debut is likely.
Rodionova, assuming she makes it, will be the oldest woman ever* to crack the top 100 for the first time. The record is held by Tzipi Oblizer, who was two months short of her own 34th birthday when she reached the ranking milestone in 2007. Rodionova will be just the fifth player to join the top-100 club after turning 30.
* I say “ever” with some caution: I don’t have weekly rankings before the mid-80s, so I checked back to 1987. Before then, the tour skewed even younger, so I doubt there were 30-somethings breaking into the top 100. But it’s possible.
Here is the list of oldest top-100 debuts since 1987:
Player                    Milestone  Age at debut
Arina Rodionova*         2024-02-05          34.1
Tzipi Obziler            2007-02-19          33.8
Adriana Villagran Reami  1988-08-01          32.0
Emina Bektas             2023-11-06          30.6
Nuria Parrizas Diaz      2021-08-16          30.1
Mihaela Buzarnescu       2017-10-16          29.5
Julie Ditty              2007-11-05          28.8
Eva Bes Ostariz          2001-07-16          28.5
Maryna Zanevska          2021-11-01          28.2
Ysaline Bonaventure      2022-10-31          28.2
Mashona Washington       2004-07-19          28.1
Laura Pigossi            2022-08-29          28.1
Maureen Drake            1999-02-01          27.9
Hana Sromova             2005-11-07          27.6
Laura Siegemund          2015-09-14          27.5

* pending!
I extended the list to 16 places in order to include Laura Siegemund. She and Buzarnescu are the only two women to crack the top 100 after their 27th birthdays yet still ascend to the top 30. The odds are against Rodionova doing the same–the average peak of the players on the list is 67, and the majority of them achieved the milestone a half-decade earlier–but you never know.
A triumph of scheduling
Rodionova has truly sweated her way to the top. She played 105 matches last year, winning 78 of them, assembling a haul of seven titles and another three finals. When I highlighted the exploits of Emma Navarro a couple of weeks ago, I couldn’t help but draw attention to the Australian, who is one of only two women to win more matches than Navarro since the beginning of last year. Iga Swiatek is the other.
Most of the veteran’s recent triumphs–44 match wins and five of her seven 2023 titles–have come at the ITF W25 level. She didn’t beat a single top-200 player in those events, and she faced only five of them. In her long slog through the tennis world last year, Rodionova played just one match against a top-100 opponent, and that was a loss to 91st-ranked Dalma Galfi.
The point is, the Aussie earned her ranking with quantity, not quality. No shame in that: The WTA made the rules, and the Australian not only chose a schedule to maximize her chances of climbing the ranking table, she executed. Kudos to her.
What her ranking does not mean, however, is that she is one of the 100 best players in the world. Elo is a more reliable judge of that, and going into this week, the algorithm ranks her 207th. (She peaked in the 140s, back in 2017.) You can hack the WTA rankings with a punishing slate of ITFs, but it’s much harder to cheat Elo.
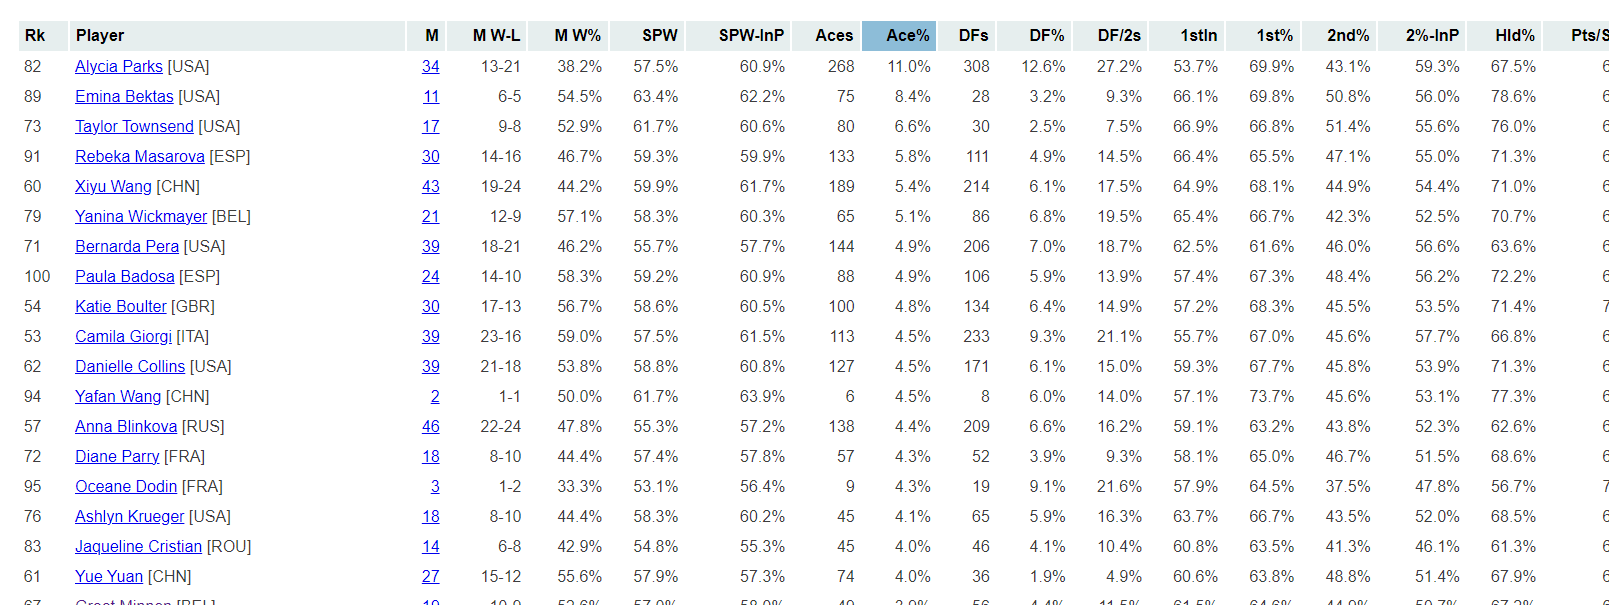
Here are the players in the official top 150 who Elo considers to be most overrated:
Player             Elo Rank  WTA Rank  Ratio
Caroline Dolehide       124        41    3.0
Peyton Stearns          145        54    2.7
Arantxa Rus             103        43    2.4
Tatjana Maria            94        44    2.1
Arina Rodionova         207       101    2.0
Laura Pigossi           221       114    1.9
Elina Avanesyan         120        62    1.9
Varvara Gracheva         89        46    1.9
Nadia Podoroska         127        67    1.9
Lucia Bronzetti         109        58    1.9
Dayana Yastremska        54        29    1.9
Once you climb into the top 100, savvy scheduling is increasingly impractical. Instead, this kind of gap comes from a deep run or two combined with many other unimpressive losses. Caroline Dolehide reached the final in Guadalajara followed by a quarter-final exit at a WTA 125, then lost three of five matches in Australia. Arantxa Rus won the title in Hamburg and reached a W100 semi-final, then lost five of six. The WTA formula lets you keep all the points from a big win for 52 weeks; Elo takes them away if you don’t keep demonstrating that you belong at the new level.
The sub-200 Elo rank suggests that Rodionova will have a hard time sustaining her place on the WTA list once the ranking points from her W25 titles start to come off the board. Until then, she can continue to pad her total and–fingers crossed–enjoy the hard-earned reward of a double-digit ranking.
* * *
Subscribe to the blog to receive each new post by email:
.jpg)
_05.jpg)
.jpg)
.png)
_05.jpg)
_(52035355412).jpg)
.jpg)
_06.jpg)
_07.jpg)