Where Should You Hit An Approach Shot?

To the backhand, obviously. Or is it down-the-line, to cut down angles? Or maybe mix things up, so the opponent won’t start leaning the right way. Should the advice be the same for men and women?

Start with the basics. For the ATP, looking at all forehand, backhand, and backhand slice approach shots (excluding serve-and-volleys and net-rushes on returns), the Match Charting Project gives us over 84,000 data points since 2020. About 96% of approach shots land in the court. Of those, a bit more than one-third end the point immediately, either as winners or opponent errors. If the approach shot comes back, the net player wins 58.6% of the time. Altogether, when an ATPer hits an approach shot, he wins the point 70% of the time.

Of course, not all approaches are created equal.

Here are men’s approaches broken down by direction:

Direction  Share   Ends   Won%  
To FH      31.9%  37.4%  70.9%  
Middle      5.8%  23.9%  53.7%  
To BH      62.3%  30.8%  70.8%

Men overwhelmingly aim for the backhand. Approaches to the forehand are more likely to end the point immediately, but if the point goes longer, the netman fares better against the backhand. Apart from the weak results down the middle, we seem to have landed on a good balance. Maybe to-the-backhand is better against a naive opponent, but pros lean that way, knowing it’s the likely shot. To-the-forehands need to be better: ATPers miss those a bit more often, and judging from the winner/induced-error rates, those land closer to the lines.

If the forehand/backhand balance is an example of a well-executed mixed strategy, those down-the-middle approaches are … something else. The relatively poor results probably stem in part from circumstance. Players can be stranded in no-man’s land and hit an approach for a lack of decent options–those approaches are probably more likely to go down the middle. Apart from desperation shots, maybe there’s some benefit in an occasional approach at the feet, just to complicate the opponent’s guessing game. In any case, the down-the-middle share (under 6%) suggests that players know that approaches should usually go elsewhere.

The overall trends for women are similar. To-the-backhand is somewhat more successful (68.9% to 66.4% in overall win percentage), and down-the-middle approaches are even less so, at 49.6%.

What about the geometry?

All else equal, it’s best to approach from the middle, though it’s only slightly better than coming forward from the forehand corner. (For men: 70.8% win percentage to 70.3%, compared to 66.5% from the backhand corner.)

Down-the-line approaches make life harder for the opponent, but they are higher-risk. More errors, more winners, and mixed outcomes overall. For men, a down-the-line forehand approach beats a cross-court forehand approach by 1.7 percentage points. Among backhands, the risks and rewards cancel each other out. For women, there’s no net advantage from either wing.

If you’re in a corner, the important thing is to avoid approaching to the middle. You probably already figured that out, given the overall numbers. From a corner, the results are even worse. When men approach down the middle from a corner, they win only 50.8% of points. For women, it’s just 47.7%. Again, a lot of that disadvantage is situational. But that doesn’t mean it’s a good idea if you have a choice.

What about shot selection?

Forehands > backhands > backhand slices. Topspin backhand approaches are better than I would have guessed: ATPers coming in off the backhand win 67.9% of points, compared to 71.8% on forehands.

Slice approaches are a modern-game disaster. Once upon a time, slice approaches were a centerpiece of aggressive playing styles, hence the term “chip and charge” and all those graceful highlight-reel shots of Martina Navratilova and Pete Sampras. Now, baseline play is just too good. Men win barely half (50.4%) of backhand-slice approaches. As with down-the-middle approaches, some of that probably stems from net-rushing in suboptimal circumstances. But that’s doesn’t explain nearly all of it. Presumably slice approaches are better on fast surfaces, especially low-bouncing grass, than this dire average. Competitors themselves, though, are increasingly skeptical. Barely one in five backhand-side approaches are slices, as players tire of watching passing shots sail by.

(Edit! Presumably, you say? I got around to checking it. On grass, men’s slice approaches end up winning the point 53.6% of the time. Better than average, still not very good. For women, slice approaches have the same outcomes on grass as elsewhere.)

The shot-type breakdown is almost identical for women. WTAers win 68% of forehand approaches, 66.2% of topspin backhands, and 45.6% of backhand slice approaches.

Context matters

Major factors that I haven’t addressed–and can’t with any precision, given Match Charting Project data–are court position and quality of the previous shot. Clearly these things matter: Regardless of shot selection or direction, an approach has a better chance of success from inside the baseline against a weak reply than it does from behind the baseline against a Jannik Sinner cannonball.

One simple proxy for these factors is rally stage. More than half of men’s approach shots in the dataset occur on the third shot of the rally: the plus-one shot. On average, this is the best opportunity to come forward, as there’s only so much the returner can do with the return.

Here’s how those compare to subsequent stages of the rally:

Stage    Share   Ends   Won%  
shot 3   50.4%  33.9%  72.1%  
shot 4    9.4%  31.1%  65.8%  
shot 5+  40.2%  31.0%  68.0% 

A plus-one approach is rarely an awkward shot. Barring a net-cord or unexpected bounce, servers will only pounce on that next shot when the circumstances favor it. So while 72% isn’t quite the win rate for an approach shot when everything is set up just right, it’s pretty close. Net-rushers will always make errors, opponents will always come up with low-percentage passes made good, and so on. Still, by the standard of tennis’s small margins, a win rate in the 70s is huge.

Women don’t show quite the same splits. They win 67.7% of plus-one approaches, then 65.3% on fourth shots and the same 65.3% for everything beyond that. The serve doesn’t set up plus-one approaches to the same degree.

Try to distill all this to some simple advice, and you might end up with something generic like “pick your spots.” While not terribly helpful, it is true: Context probably matters more than forehand-versus-backhand or down-the-line-versus-cross-court.

As for concrete tips: If you’re forced to hit an approach up the middle, maybe don’t approach, unless the alternatives are even worse. And if you don’t need to go up the middle, hit your approach somewhere else. Anywhere else!
How Long Does Return Quality Matter?

A deep return is better than a shallow one. A return to a corner is better than one down the middle. There’s no doubt that return placement matters, but how long does it matter?

With every shot after the return, it is logical that the effect of the return would decay. A strong return might not go for a winner, but it probably induces a weak reply, making it more likely that the returner can end the point on her next shot. But if she doesn’t, if the rally continues to 6, 10, or more shots, at some point the quality of that return is no longer a factor. Either she sacrificed the advantage it gave her, or her opponent defied the odds to get back on neutral (or better) terms.

You guessed it: We can quantify this.

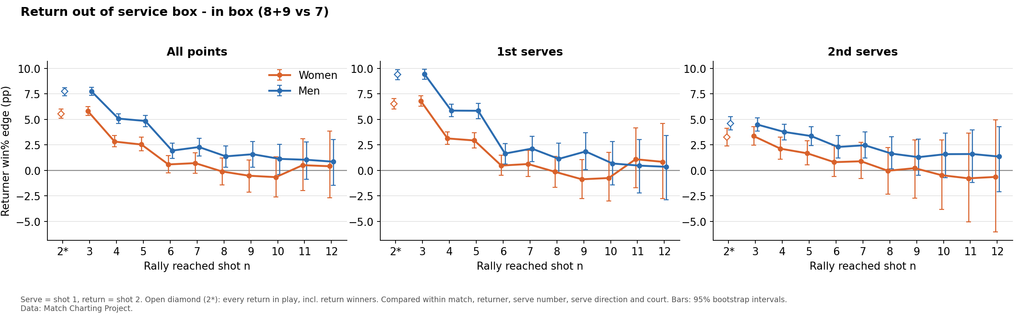
Drawing on the thousands of 2020s matches logged by the Match Charting Project, let’s start with the simplest comparison: returns that landed beyond the service line versus those that landed in the service box. Deeper is unquestionably better: For men, a back-half return means winning the point 50% of the time, while an in-the-box return is good for only 41.4%. Even controlling for match (opponent, surface, etc), the difference is 7.7 percentage points.

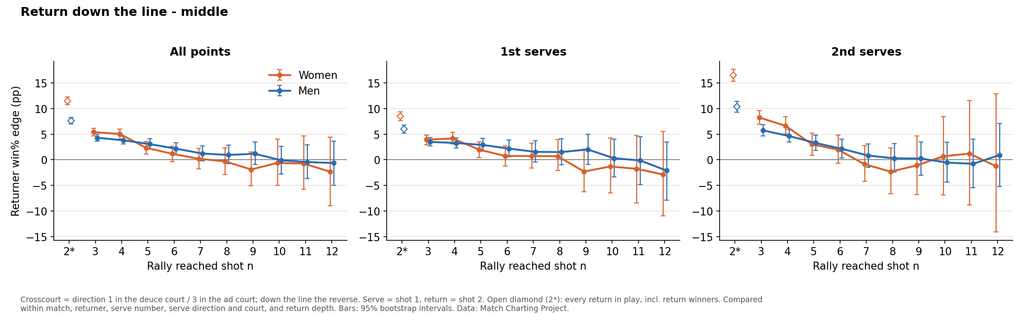
Most of that advantage shows up in just a few shots after the return. These plots show the percentage-point advantage of a deeper return at each stage of a rally:

Return depth matters more, and for longer, in the men’s game. A back-half return against a first serve is worth about 2.5 percentage points more to men than to women. Against first and second serves, return depth plays a role up to at least the eighth shot.

For women, this basic measure of return depth loses half of its predictive power once the rally reaches its fourth shot. By then, the server has either capitalized and ended the point, or she has squandered her advantage. (Or the return was good enough that she didn’t have an advantage to squander.) By the sixth shot the return is barely a factor at all: The confidence interval says the effect could be zero.

The server’s natural control of the point also explains the stair-step nature of the graph. A big part of the difference between return influence on 3-shot rallies and 4-shot rallies is that the points with the weakest returns become third-shot (plus-one) winners. There is no fourth shot. The effect is similar, if smaller, between the 5th and 6th shots as well, in some of the plots.

What about angles?

An ideal return forces the server to move away from the middle of the baseline. Intuitively, it seems like line-kissing returns affect the development of a point differently than deep ones do. To overgeneralize: If the server has to move, he could immediately be at a disadvantage. A deep return, by contrast, merely stops him from putting the point away.

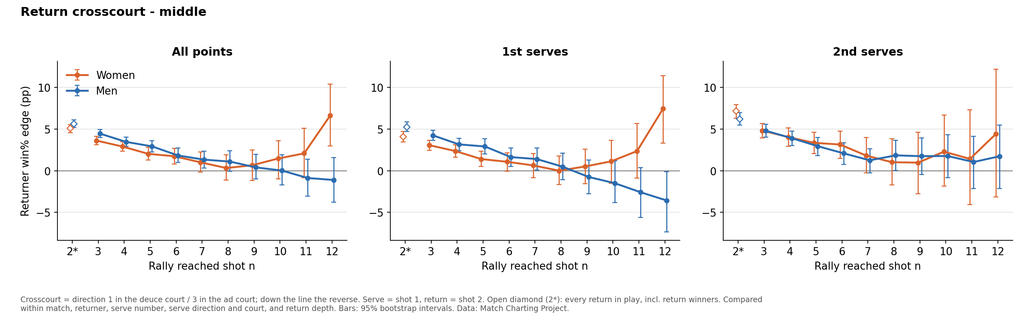
The next set of plots show the difference between down-the-middle returns and crosscourt returns. (That is, crosscourt to the ~third of the court closest to the opposite sideline.) For men, the difference between crosscourt and middle isn’t as great as the gap between back-half and front-half. For women, it’s about the same. The return still remains a factor until the sixth or seventh shot:

(Ignore the women’s trend lines that head back upward for long rallies. That might be a selection effect. Maybe returners who neutralize the server’s advantage are more likely to come out ahead in marathon points.)

Down-the-line returns are a little different. The biggest effect of hitting in that direction is an increase in service winners: In the next set of plots, check out the diamonds in the 2* column for second serves. That column includes all non-ace points; the other data points on the graph depend on the server putting a second ball in play:

I expected that crosscourt returns would both be better than down-the-line returns and have a longer-lasting influence. I was wrong about the first. All else equal, down-the-line returns are a bit more effective, assuming they land in. Maybe servers expect a crosscourt return and lean that way. There’s a stronger case for the second. The advantage of a down-the-line return is gone for women by the sixth shot of the rally, the seventh shot for men.

Finding the backhand

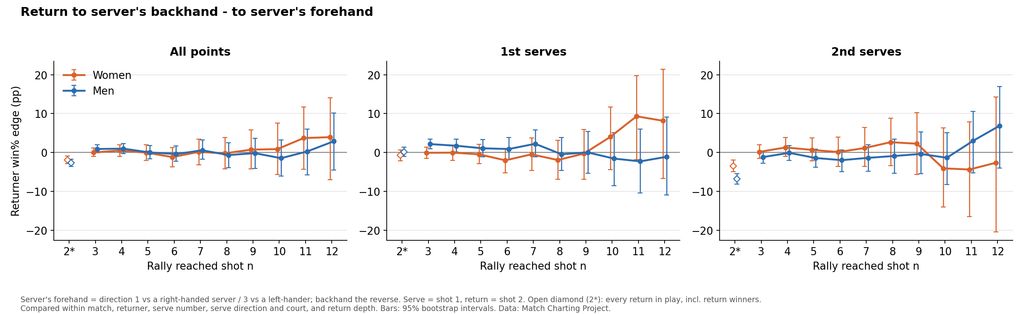
Often, the returner’s goal isn’t to hit a particular corner, it is to target the server’s weaker side. For men, especially, that side is usually the backhand. Maybe there’s a detectable advantage–and ensuing influence–in finding the server’s backhand?

The evidence says: Not really. On men’s first serves, a little bit, and it’s gone after another stroke or two. The plots tell the story:

Of course, tennis is complicated and these are descriptive statistics, not recommendations. Returners have to weigh several factors (assuming they have time to think at all), not just which wing to target. If men tried to hit more returns to the backhand side, they’d have to do so with opportunities that aren’t as well-suited to a return in that direction, and that next marginal percentage point of returns-to-the-backhand might not be as good. In that sense, seeing near-equal outcomes for returns to either wing suggests that returners have found a reasonable, if not quite optimal, balance.

What about the extremes?

So far, we’ve been looking at one variable at a time. What’s the difference between a really well-placed return and a poor one? To put it another way, how much does return location matter at the extremes, and how long does the difference persist?

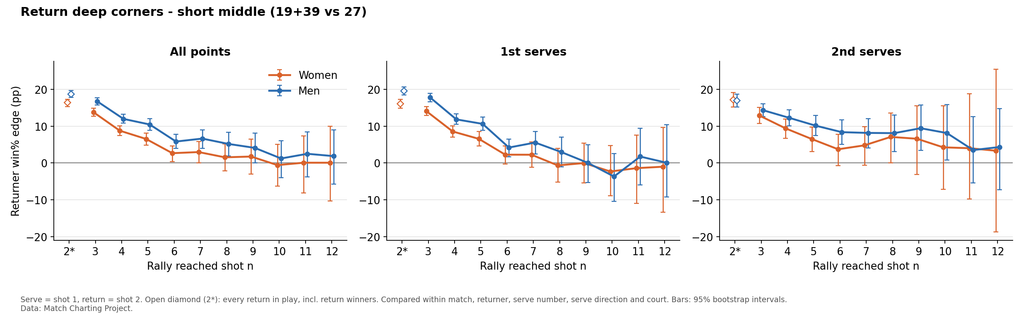
We can measure that by comparing “shallow-middle” (service box, middle third of the court) with “deep-corner” (back quarter of the court, outer thirds of the court) returns. The difference is substantial–nearly 20 points of win percentage for men on both first and second serves–but it doesn’t last much, if any, longer than the other effects we’ve seen:

For women, the advantage of a very well-placed return is almost entirely gone before the sixth shot of the rally. It lasts longer for men, with the confidence interval touching zero only on the ninth shot. Still, both server and returner have just a short window in which to capitalize on a weak or strong reply.

Putting it all together: A good or bad return affects the development of the rally even after more shots have been struck. But not forever: If somebody tells you that a return set up a winner on the 12th stroke of a rally, they’re overstating the case. A good service return can accomplish a lot, but its powers are not unlimited.

Do Groundstrokes Break Down?

The human brain is a trend-spotting machine. A couple of groundstroke errors in a row, and fans and commentators conclude that a player’s stroke has gone off the rails, perhaps because her opponent has exerted just the right pressure. Shots, we say, can “break down,” and even that opponents can “break them down.”

Except… an awful lot of the trends we spot are mirages, misguided attempts to make sense of noisy data. Yesterday, we learned that first serves aren’t streaky. For pros, missing one doesn’t make it more likely that you’ll miss the next; women even tend to make slightly more first serves after misses. So, what about groundstrokes?

It’s a trickier phenomenon to pin down, because unlike first serves, forehands (or backhands) are not all created alike. After missing one forehand, you might not see one on the next point or two. Or if you do, it could be at a different angle, a different height, a different court position, and so on. Still–and long-time readers are going to struggle to believe me on this–there is a detectable effect! Really!

Based on women’s matches since 2020 logged by the Match Charting Project, if a player makes a forehand unforced error on one point, she is 0.45 percentage points more likely to make a forehand unforced error on her next point with a forehand in it. It’s a tiny shift, representing about a 2% tick upward from the typical error rate around 20%, but it is real. The results are about the same (slightly weaker, but in the same neighborhood) for backhands. Men are in the same neighborhood, as well.

But wait: If we control for set, establishing our expected error rates for a single set rather than the entire match, the effect shrinks, and for men, it vanishes almost entirely.

This is good news and bad news. There’s little or no short-term influence of one error on the next opportunity to hit that shot. But error rates do drift over the course of the match.

Drift away

Splitting matches into chunks of 20 forehand points, error rates move around quite a bit more than that sub-half-point shift. Without controlling for set, the typical WTAer sees her forehand UFE rate jump around 1.4 percentage points more than would be expected from chance alone. That’s still not detectable within a single match, but it is a meaningful difference in the long run. Over the last 52 weeks, the range in UFE rate between the most error-prone player (Anna Kalinskaya) and the least (Belinda Bencic) is only 9 percentage points. 1.4 points represents a jump of several places at most positions on the leaderboard.

A bunch of subsequent tests reveal some aspects of that drift. For one thing, it’s usually not a single stroke that ebbs and surges. When a player starts making more errors, both wings suffer. There’s a hint in the men’s data that forehand and backhand error rates don’t quite move in lockstep, but the data is inconclusive.

It’s also clear that players seize on their opponents’ sloppiness. You can probably imagine situations where gaffes seem contagious and no one can keep the ball in the court, but typically, one player tightens up his (or her) game while the other one struggles. I don’t know which direction the causation points: Does one player “break down” the other? Does she take advantage of her opponent’s errors and play more conservatively? Anything along those lines is just speculation at this point.

The strongest effects, though, were somewhere I didn’t intend to look. Error rates shift chronologically, both across sets and within them, in predictable ways.

Tightening up

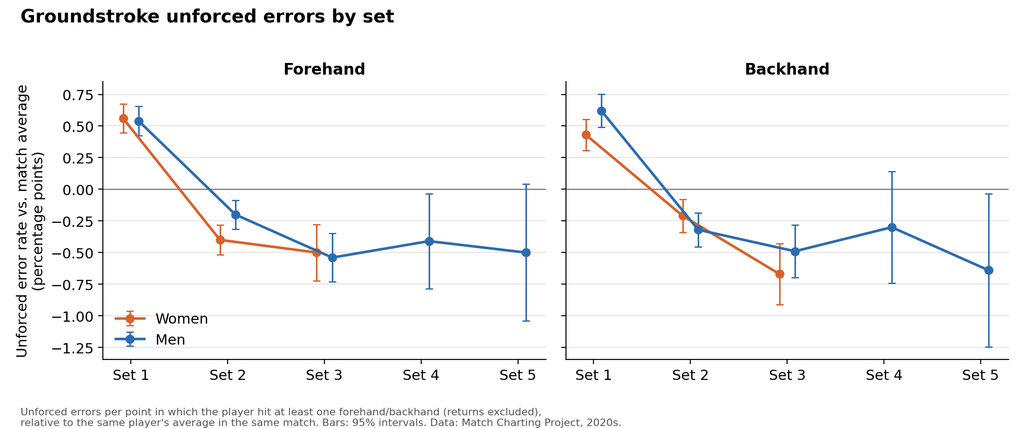
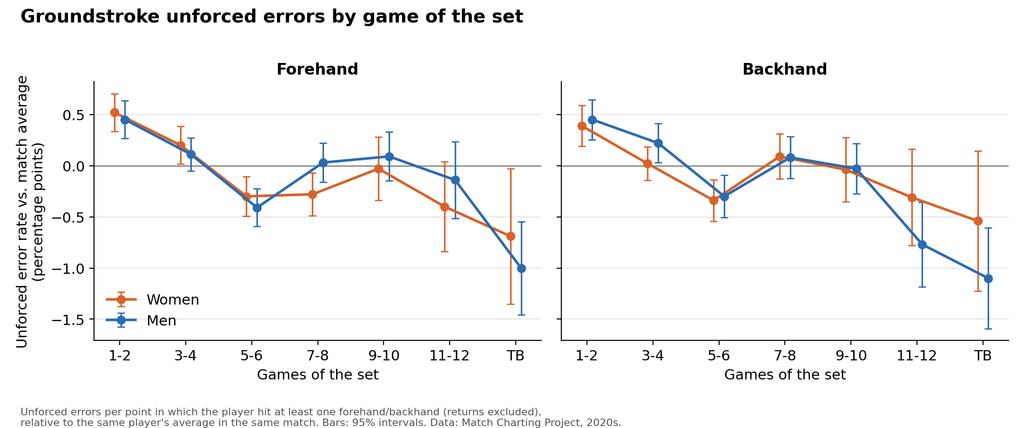
These graphs show the trend in relative unforced error rates by set, for both men and women:

On both wings, players make more errors in the first set. Women improve their forehand error rate by almost a full percentage point between the first and second sets. While there’s not much movement after the second set, the rates stay well below the first-set standard.

Before we speculate about the causes, let me show you another pair of plots, now comparing relative error rates within sets, by pairs of games:

Again, we start high then tack lower. Though it’s not an unequivocal downward trend, the first two games are consistently the most error-prone, and tiebreaks are the least. (Players become more conservative in tiebreaks by just about every possible metric, from serve speed to rally length to errors.)

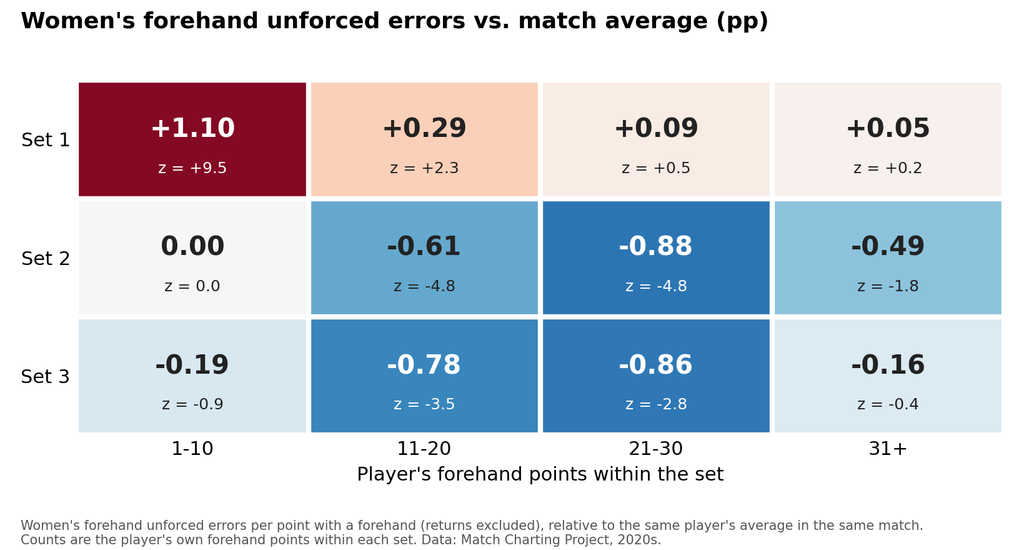
Combine those two effects, and you have some sloppy opening games. Here’s one more plot, using WTA data, showing each set broken into chunks of 10 forehand points. The top left corner is the beginning of the first set; the bottom right is the end of the third. Red means more errors than expected (the numbers are percentage points), blue means less:

Every set tightens up as it goes along, but my oh my are those first ten points brutal. These shifts account for much of the “drift” within matches. Error rates move for reasons other than chronology, but chronology is a single factor that seems to affect a large number of players.

Sloppy or aggressive?

High error rates are not inherently bad: Jelena Ostapenko has made a career out of winning matches when she loses one of three points with a (wild) miss. The trick is to pair errors with winners, to take the good aggression with the bad.

That’s not what’s happening here! For women, on both wings, winner rates are at their lowest in the first set. Within sets, winner rates are lower in the first two games than they are until 5-5, when tiebreak caution starts to take over.

These numbers strongly point toward a “warm-up” effect at the beginning of the match and a smaller “re-set” effect at the start of each subsequent set. Maybe that’s understandable: No amount of actual warming up can prepare you for the reality of a new opponent’s individual mix of speed, spin, and angles. And despite the dark red of that upper-left-hand heatmap cell, we’re still only talking about a shift of one percentage point: Enough to pick up across 4,000 charted matches, but far too small to notice even in a fortnight of attentive tennis-watching.

What about the players?

Up to this point, we’ve been talking about averages. We don’t have enough data to identify tendencies for most players, but we can find some.

One of the strongest individual-player findings for women is that Coco Gauff’s error rates drift quite a bit within a match: about three percentage points compared to less than two for the average player. Gauff is slightly more prone than average to a sloppy start, as well, but the full-match metric excludes the first 20 baseline points, so her variance goes far beyond that.

By contrast, Aryna Sabalenka and Iga Swiatek are remarkably steady, showing effectively no in-match variation in error rates beyond what would be expected from chance.

Sabalenka also stands out in that her aggression (winners plus errors) goes up under pressure, defined as the ninth game of a set or later, with the score within one game. The effect is small–a bit more than one percentage point–but it is striking because the average trend under pressure is negative. Gauff, Elena Rybakina, and Jessica Pegula all score about one percentage point in the opposite direction, more conservative under pressure than the average player. Iga is almost precisely average.

I haven’t said much in this post about men, because the trends are generally the same across both tours. Still, there are some interesting individual numbers for ATPers.

Both Stefanos Tsitsipas and Grigor Dimitrov see even more error-rate drift within a match than Gauff. Lorenzo Musetti is the slowest starter, committing the most errors (relative to match averages) in his first 20 chances per match of all men for whom I have a lot of data. It’s suggestive, though hardly conclusive, that those three outliers all have one-handed backhands. I can sympathize: If I play a match on Monday morning, my backhand starts rounding into form on Wednesday afternoon. (Tsitsipas and Dimitrov, for what it’s worth, aren’t slow starters; their error-rate drift comes later.)

A slow start isn’t necessarily bad. Second on that list behind Musetti is Carlos Alcaraz, even though Carlitos scores about average for general within-match drift.

Jannik Sinner’s career of bloodless executions turns up in the data as well. His within-match drift is the lowest (tied with Felix Auger-Aliassime, surprisingly enough) of all players with enough data. In the big moments, he grinds you down, committing fewer errors under pressure and improving his winner-errors ratio. He isn’t the most conservative in the big moments, though: That honor belongs to Novak Djokovic, with the perpetually cautious Alexander Zverev right behind him.

Circling back to where we started: Pro groundstrokes don’t really break down. They take a few games to reach optimal form, and on occasion, they rattle a bit. Most of the apparent trends we spot as fans are fake. But in this case, there are indeed a few drops of water in the desert of statistical noise.

The Point After a Second Serve

Here’s a hypothesis for you: First serves are streaky.

It seems unquestionably true for amateurs. Our serves start clicking, or more commonly, fall apart entirely. Pros, though, are built different. After untold thousands of serves in practice, they should be steadier. The question, then, is whether they exhibit any streakiness at all, whether one missed first serve makes it more likely that they’ll miss the next one as well.

We can test this with the ever-growing dataset that is the Match Charting Project. Across over 4,000 charted men’s matches since 2020, the effect of one missed first serve on the next first serve is basically … zero. Not exactly: Men might be very (very) slightly anti-streaky, meaning that they are more likely to land a first serve on a point after a first-serve miss. But the effect is indistinguishable from zero, and the natural yo-yo of alternating deuce and ad courts erases anything that’s left. Some players have different results on the deuce and ad sides, so they are more likely to “recover” from a miss simply because they get to switch back to their preferred serve direction.

A few individual men show up as more streaky (or resilient, to use a more pleasant if less precise term for “anti-streaky”) than the norm. In the 2020s data, Novak Djokovic comes out as one of the most streaky, while Carlos Alcaraz scores among those at the other end of the spectrum. The magnitude, though, is tiny: We’re looking at shifts of about one percentage point in first-serve-in rate after a missed first serve. There’s not even enough data to be sure there’s an effect at all. Even if there is, that one percentage point translates to about one extra missed (or made) first serve every four matches, on average. It’s certainly not something you could detect by watching a match, or even a full tournament.

The story is somewhat different for women. Again using Match Charting Project data from the 2020s, spanning another 4,000-plus matches, we find that women make more first serves than expected on the point after they miss one. “Resilient” or “anti-streaky,” it doesn’t hold for every single player, but it’s a clear trend across the tour. As with the men, deuce/ad explains some of it, about one-fifth of the overall effect. What about the rest?

It would be one thing if there was simply no streakiness: We could give credit to the players for having trained themselves to the point that they are human ball machines. Maybe there’s something psychological, where players see a mistake, make adjustments, and temporarily become even better servers than their typical selves. More likely, though, it’s tactical. My instinct is that the average woman’s first-serve rate goes up because, having just missed a first serve, she becomes more conservative.

The evidence supports my guess. On first-serve points after a first-serve miss, women win 0.3 to 0.4 percentage points less often, compared to other first-serve points within the match. It’s possible that the additional lost points don’t stem directly from serve tactics, but the persistence of the effect points strongly in that direction.

We can even be a bit more specific. The difference is not speed: I checked the first-serve speeds after first-serve misses from Wimbledon and the US Open between 2021 and 2024. Controlling for serve direction, women served just as hard on those follow-up points, possibly even a tiny bit harder. If the point-outcome data can be trusted, the conservatism comes from serve placement, not direction (wide/body/T) or speed.

The net effect of all this is basically neutral. It’s good to decrease the odds of another second serve, but a slightly weaker first serve reverses some of that benefit. After missing a first serve, women servers win points at about the usual rate.

Double faults

Everything we’ve seen so far is a tiny effect, and it’s virtually no effect for men. The psychological or tactical shift is a bit clearer when we shift from missed first serves to double faults.

After a double fault, both genders dial things back with their next first serve. Men drop about 0.25mph from their average first serve. Roughly half of that comes from picking safer targets: They are less likely to fire one down the T, where margins are smaller. Women show a much bigger effect, dropping just over 1mph from their first serve. More than half of that comes from the direction. They, too, opt for body or wide serves as they seek to get things back on track.

Here, the results are far from neutral. There’s some degree of momentum regardless of which serves go in. Both men and women are a bit more likely to win a point after winning the previous point. But a double fault is recognizably different than a point lost by other means. The average woman’s first-serve winning percentage drops by almost a full point after a double fault, compared to other ways they could have lost the previous point. A couple of studies of mine suggest that 1mph in serve speed will move first-serve win percentage between 0.2% and 0.5%. So serve speed explains part of the win-percentage drop after double faults; other manifestations of serve caution, like placement, may account for the rest.

The men’s serve-speed drop is much smaller, so it’s no surprise that the point-result effect is smaller as well. The data doesn’t allow us to be as confident about this one as a real effect, as opposed to just suggestively-oriented noise.

My initial hypothesis was wrong, but the investigation turned up some momentum (and anti-momentum) effects that are worth more attention. Should players try to keep their first-serve risk level steady, or is a conservative offering a good way to get back on track? Is it possible to go wide or to the body without giving up quite so much? Should returners lean more in that direction, knowing that a double fault could influence the next serve? Beats me!

An Inside-Out Attempt to Classify Playing Styles

Are Paula Badosa and Emma Navarro actually the same player?

Every so often, an analyst introduces a new way to classify playing styles. The approach usually involves taking a bunch of different stats and identifying clusters of more or less similar players. One group might be aggressive, flat hitters; another might be clay-court experts; a third might be serve-plus-forehand specialists.

Two problems. First, tennis stats tend to be highly correlated. If you’re good at one thing, you’re probably good at most other things. Second, the stats we have aren’t that great. Sometimes we get goodies like spin rate and shot speed from broadcasts, but that’s the exception. Instead, we have to build classifiers from pedestrian metrics like second-serve win rate or–at best–charting-based stats like Backhand Potency and Aggression Score. All of these things are tied to points won, which brings us back to the correlation problem.

I don’t have a solution. I do, however, have a zany idea that might just yield some insights. Instead of classifying players by the most granular metrics we have, what about identifying styles from results?

If two players have the same unexpected head-to-head against, say, Iga Swiatek, they might just have something in common. If both players have similar unexpected head-to-head records against many opponents–not just Iga–it’s probably not just a coincidence, right? We might be able to look at their playing styles and see that they are troubling opponents in similar ways, but even if we didn’t know the first thing about their skills or tactics, we could spot the parallels in their results.

The concept is simple enough. The math is not, and more importantly, the results offer more questions than answers. It’s possible this is a dead end, but I can’t see far enough around the next corner to be sure.

Welcome to the matrix

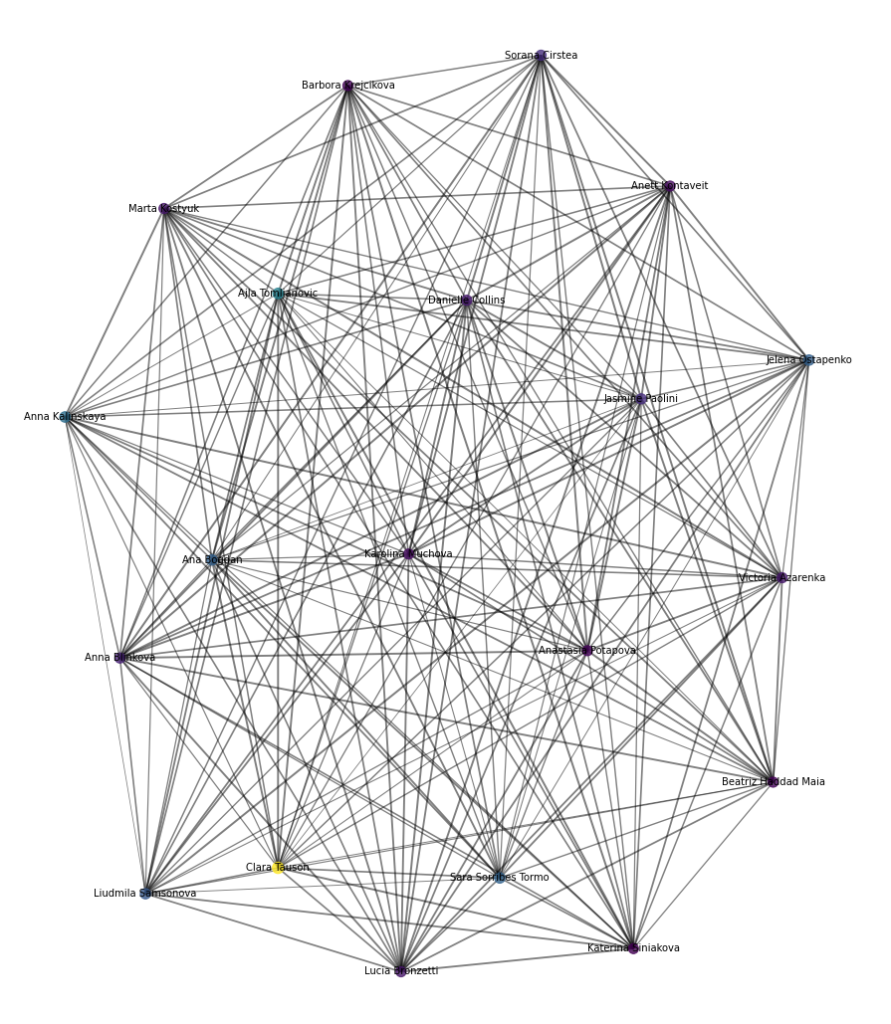
We’re going to dive into the weeds in a moment. Surely this network graph will entice you to come along?

Those are the 20 most “unique” players in the dataset. The degree of similarity between each pair of players is represented by the thickness of the line that connects them. (I know, you can’t really tell most of the lines apart.) Clara Tauson is a yellow dot because she’s by far the most unique of all.

We’ll come back to that, maybe.

Here’s how this works. I took the 60 players with the most tour-level wins since 2021 and found all the meetings among them. For each pair of players, I used pre-match Elo ratings to determine how “unexpected” the results were, and in which direction. For example, Elo ratings say Jelena Ostapenko usually has a ~20% chance of beating Iga, yet she has done so every time. Ostapenko’s score vs Swiatek, then, is +0.8, and Iga’s score for the same matchup is -0.8. Very few scores are so extreme. Most head-to-heads go roughly as expected, so they hover around zero.

Each player, then, has a score against every other player. Next, I use a method called matrix factorization to analyze and compare those sets of scores. Matrix factorization is commonly used in recommendation systems–if you and I give similar ratings to a bunch of movies and I like a new movie, you’ll probably like it, too. In tennis terms, say that Players A and B have unexpected results against many of the same players. If Player A upsets Aryna Sabalenka, Player B might have a better shot than we think to knock out Sabalenka as well.

In theory, this approach should capture some things about playing style, but it doesn’t actually know anything beyond the Elo-adjusted head-to-heads. Matrix factorization looks for efficient ways to characterize the relationships between players. Those might correspond to real-world attributes like “heavy topspin” or “attackable second serve,” but they might be incomprehensible to us lowly humans.

Mostly incomprehensible

The algorithm decided that the cleanest solution was to divide the 60 players into ten categories. I’ve numbered them, but the order doesn’t matter. Here’s one:

1: Azarenka, Bencic, Kalinskaya, Kasatkina, Kostyuk, Mertens, Parry, Rybakina

    Ok… some flat hitters (except Kasatkina), nobody who likes taking a lot of risk… you can sort of see what’s behind this one. Next:

    2: Alexandrova, Anisimova, Frech, Kontaveit, Muchova, Pegula, Schmiedlova, Vekic

    Flat hitters who swing big, though I wouldn’t have put Pegula in this group. Muchova isn’t a great fit either. Another one:

    3: Begu, Krejcikova, Kvitova, Linette, Maria, Siniakova, Svitolina, Swiatek, Tomljanovic, Vondrousova, Qinwen Zheng

    Ah yes, those noted twinsies, Iga Swiatek and Petra Kvitova. Matrix factorization works in mysterious ways, I guess. Next is my favorite:

    4: Bogdan, Tauson

    Tauson, as noted above, is the most unique player in the dataset. Bogdan is not far behind. That’s the only thing they have in common, right? Onward:

    5: Badosa, Garcia, Haddad Maia, Navarro, Pliskova, Potapova, Sherif

    Almost as head-scratching as the Iga group. Are there any players you’d be less likely to group together than Caroline Garcia and Mayar Sherif? For what it’s worth, the algorithm thinks Badosa and Navarro are the two most similar players in the dataset.

    We don’t need to comment on them all, but here are the rest:

    6: Bouzkova, Kudermetova, Ostapenko, Samsonova

    7: Putintseva, Shnaider, Sorribes Tormo

    8: Blinkova, Bronzetti, Collins, Fernandez, Kalinina, Parrizas Diaz, Sabalenka

    9: Cirstea, Paolini

    10: Cocciaretto, Cornet, Gauff, Gracheva, Jabeur, Keys, Osorio, Sakkari

    If these groupings were based on traditional or charting-based stats, I’d assume there was a coding error. As it is, the clusters do not inspire confidence in this alternative method.

    Style-ish

    Those groups were determined by how players rated on three “style factors” that the algorithm extracted from all those head-to-head scores. Again, we don’t know what they correspond to in the real world, but each one is associated with how players over- and under-perform their ratings.

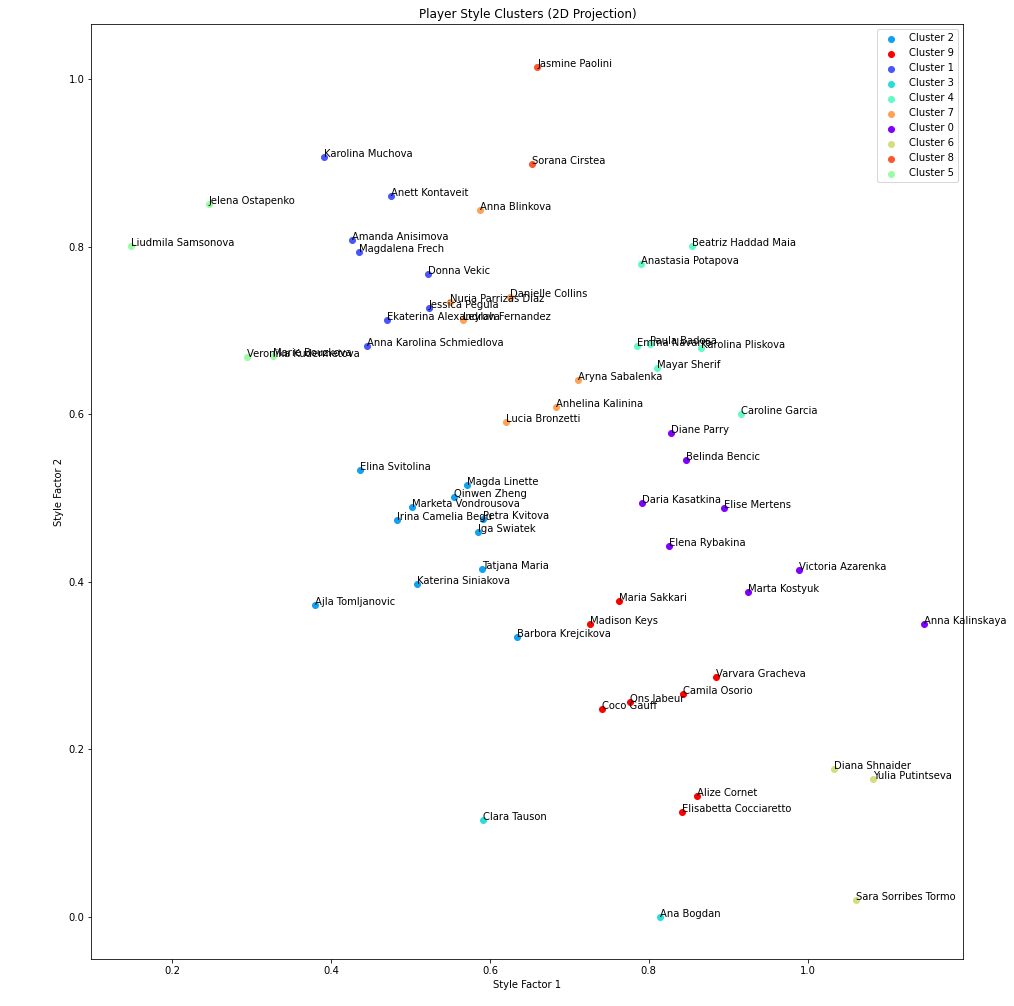
    This plot shows how players measure up on the first two style factors:

    Ostapenko and Samsonova in one corner, Sorribes Tormo (and Putitnseva, and Bogdan) in the other? This might actually make some sense! From left to right, we have a very approximate ranking of most aggressive to least aggressive, though with curveballs like Marie Bouzkova on the left side (hidden just to the left of Schmiedlova) and Garcia on the right.

    Top to bottom is harder to parse. There’s some correlation between these two style factors, so there’s a whisper of aggression level there. But Paolini on top? I wouldn’t have thought there was any attribute, positive or negative, where she would stand out so much from the crowd.

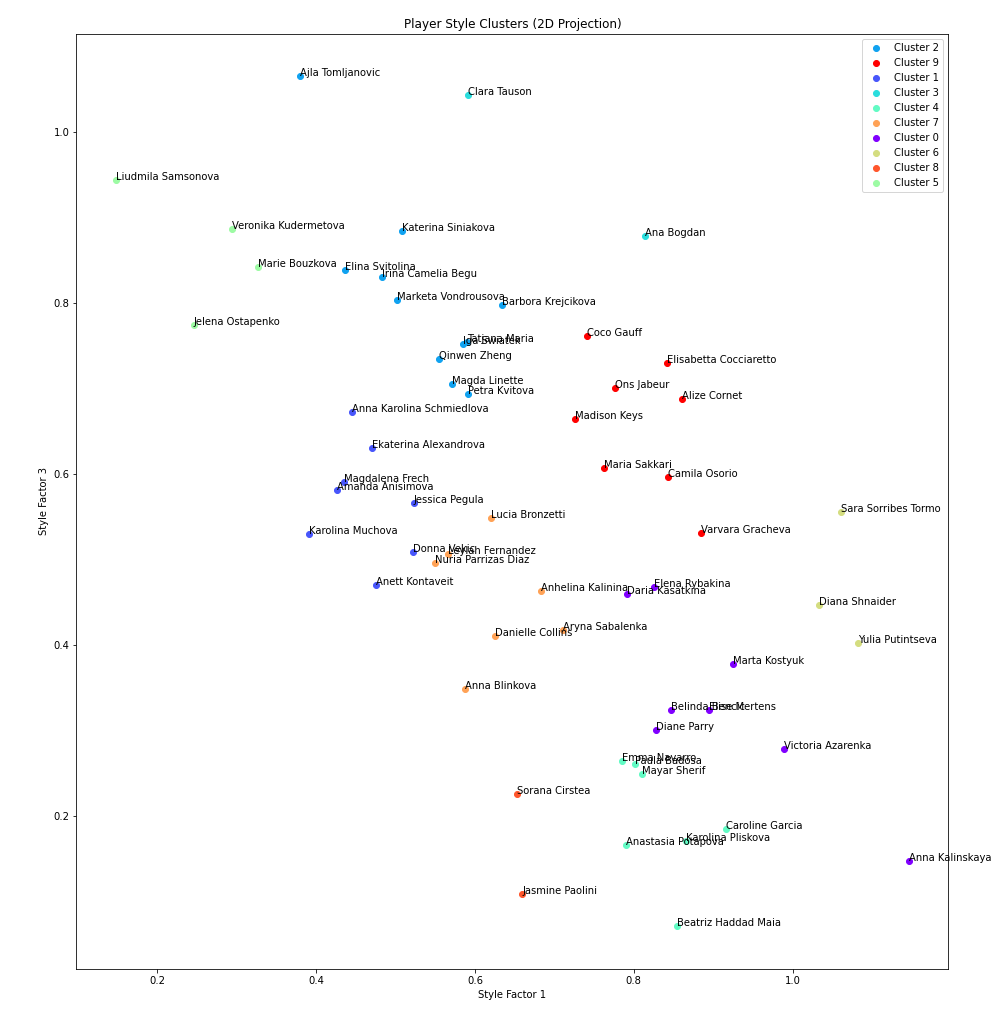
    Here are scatterplots showing the first and third factors:

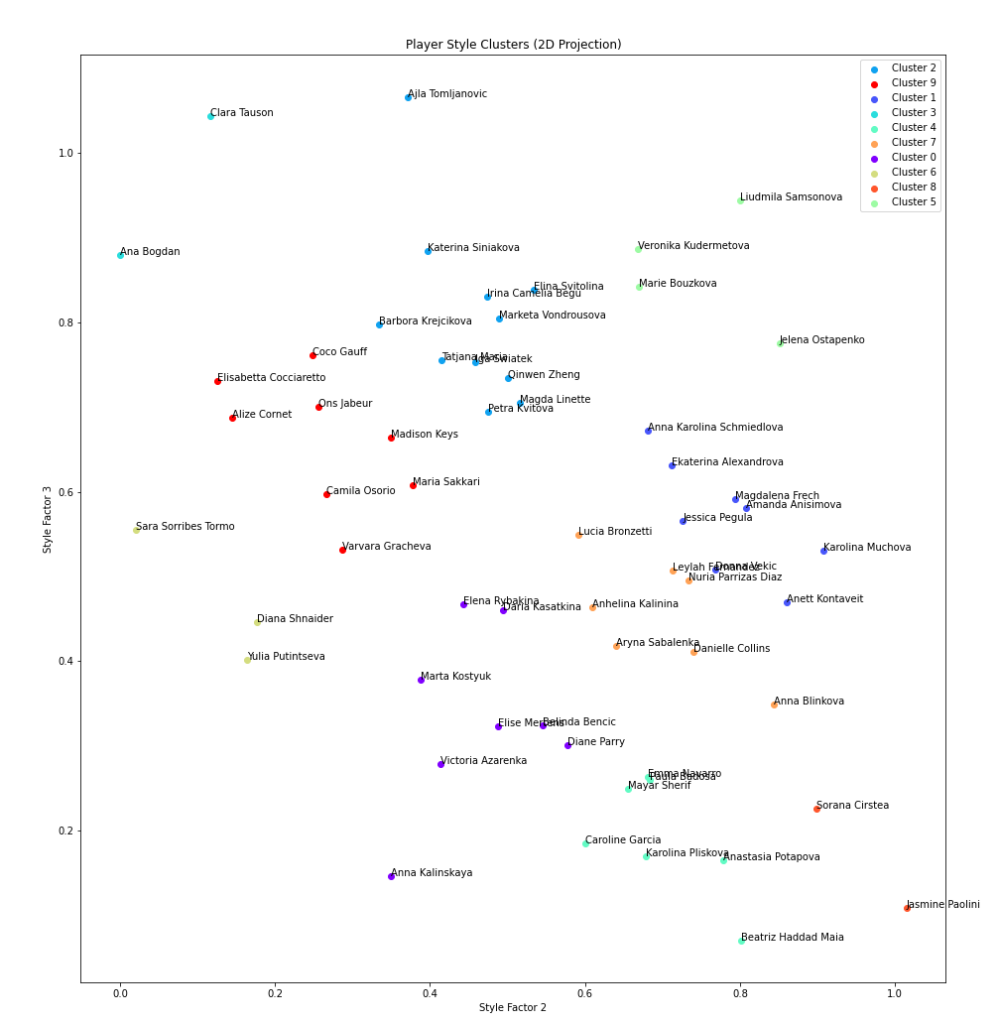
    And the second and third:

    I don’t know, man. Iga is hidden in the middle graph because she’s so close to Tatjana Maria. That pretty much says it all.

    A game of matchups

    Here’s the thing–this should work, right? Players have strengths and weaknesses that don’t change too much over time. They are susceptible to certain types of opponents, and they feast on others. People talk like this all the time: It’s why they say tennis is a game of matchups. Coco Gauff struggles against this sort of player, her next opponent is this sort of player. Upset watch!

    It’s possible that my zany idea does work. We could use these clusters and similarity metrics to tweak the Elo prediction for each match and see whether the results improve. Incorporating head-to-heads in pre-match forecasts barely moves the needle, but that’s mostly because there are so few meetings between most pairs of players. Looking at clusters of players increases the sample size, even if there’s a cost in precision. While we might never figure out what these style factors mean, the proof would be in the forecasts. Maybe.

    I don’t have it in me to run that test, at least not this week. Let’s imagine that we did, and that we discovered this was all a worthless exercise. Here are some possible reasons why:

    • Players change too fast. This might be why Paolini is such an outlier: She’s barely the same player she was a few years ago. Any attempt to characterize her will struggle to reconcile 2021-Jasmine with 2024-Jasmine. And she’s hardly the only one to have made noteworthy changes. What’s more, pros are plenty aware of their weaknesses. The type of opponent that bedevils Mirra Andreeva this year might be the focus of an offseason training block.
    • Players are streaky. I suspect that Tauson registers as so unique because she has won and lost in bunches. She reeled off seven in a row in January, but not because she lucked into the right types of opponents. On the flip side, she lost six straight last summer. In both cases, the streak was more about her form than about the styles on the other side of the net.
    • There’s not enough data. In theory, each player’s “profile” is a set of 59 head-to-head scores. But in the last four years, fewer than three-quarters of the possible head-to-heads have been played. Of those, about 40% consist of just one meeting. I’ve given the one-meeting scores less weight, but that’s still a lot of room for noise to take over the profiles.
    • Tennis isn’t really a game of matchups. I’m not willing to go this far, but I do believe that the “game of matchups” business is overstated. For every lopsided Ostapenko-Swiatek head-to-head, there are dozens more boring ones, 2-1 in favor of the better player. The “matchups” line is invoked more often after a match is over, as part of a post-hoc narrative. Betting lines hew far closer to style-neutral Elo ratings than to any kind of matchup/style profile.

    Like I said, more questions than answers. I started this project with ATP data, and believe it or not, the results for men were even more puzzling.

    If you think you know why Sabalenka is grouped with Anna Blinkova and Nuria Parrizas Diaz, the comments are open.

    * * *

    Subscribe to the blog to receive each new post by email:


    More About Drop Shots: Alexander Bublik Edition

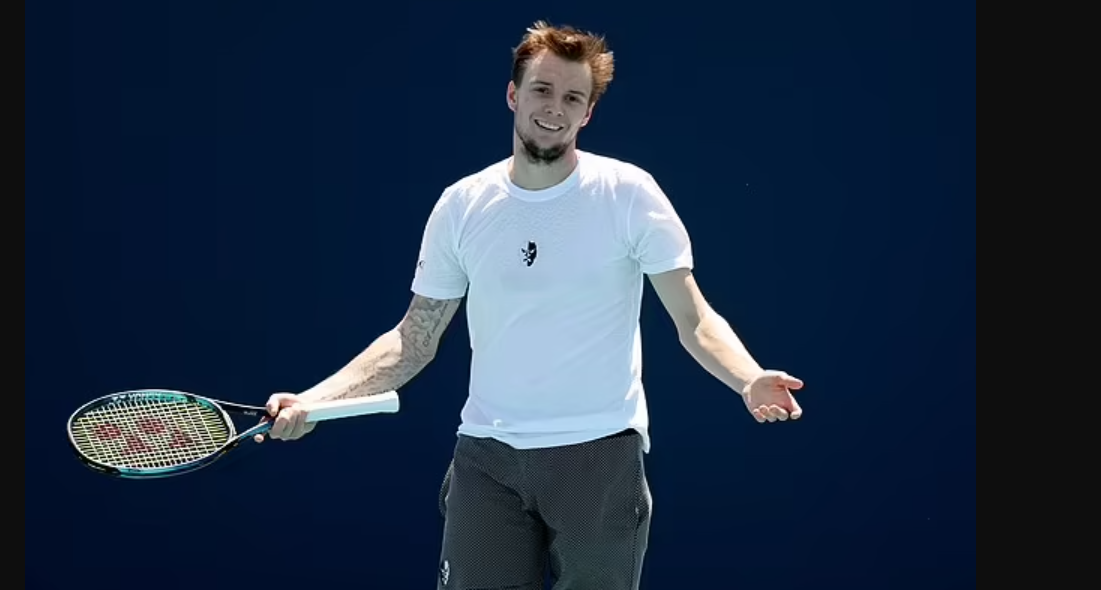
    Alexander Bublik in 2022. Credit: Getty

    If Carlos Alcaraz is the prince of the drop shot, Alexander Bublik is the court jester. We learned this week that Bublik hits droppers more than any other tour regular, about once every 14 points. That’s three times as often as tour average. No one else goes to the well more than once per 19 points.

    Persistence aside, Sasha’s results are mixed: He wins about 45% of those points. That’s unimpressive compared to the ATP norm of 54%, and it’s particularly weak next to Alcaraz’s mark of 62%. Assuming that drop shots are, on average, hit from a neutral rally position, one in which each player has a 50% chance of winning the point, Bublik costs himself 3.3 points per thousand with his drop shot. In the last decade, only Benoit Paire has been worse.

    On the other hand, the number rests on a big assumption. Alcaraz excels from the baseline; Bublik relies more on his serve. For any given situation–say, 5th stroke of a second-serve point, ball coming to the backhand side–Carlitos probably has a better chance of winning it, drop shot or not. Indeed, based on Match Charting Project data, Alcaraz wins 52% of points from that position. Bublik manages only 46%.

    That’s typical. Here are the six situations in which Bublik hits the most drop shots, broken down by whether he is the server or returner, whether it’s a first- or second-serve point, the stage of the rally, and whether he’s faced with a forehand- or backhand-side shot. The table shows the probability that he wins the point if he doesn’t hit a drop shot:

    Sv/Ret  Serve  Shot  Side  Exp W%  
    Sv      1st    3rd   FH     57.4%  
    Ret     2nd    4th   BH     42.8%  
    Sv      2nd    3rd   FH     48.2%  
    Sv      1st    3rd   BH     51.6%  
    Ret     2nd    4th   FH     42.5%  
    Sv      2nd    3rd   BH     46.1%  
    Ret     1st    6th+  FH     42.2%

    Only two of these scenarios favor Sasha: Plus-one forehands and plus-one backhands behind a first serve. Just about anything else and he’s the underdog.

    Here are the same six situations, with expected point winning percentages for Alcaraz:

    Sv/Ret  Serve  Shot  Side  Exp W%  
    Sv      1st    3rd   FH     60.7%  
    Ret     2nd    4th   BH     51.5%  
    Sv      2nd    3rd   FH     57.3%  
    Sv      1st    3rd   BH     54.1%  
    Ret     2nd    4th   FH     53.6%  
    Sv      2nd    3rd   BH     50.7%  
    Ret     1st    6th+  FH     55.1% 

    When Carlitos opts for a drop shot, he’s trading in what’s already a positive expectation for one that he hopes is even rosier.

    Repeat this exercise for every situation in which Bublik has hit a drop shot, take a weighted average, and we find that had he not hit drop shots, he would have won 46.5% of those points. With that in mind, his 45.4% drop-shot winning percentage doesn’t look so bad.

    The recalculation doesn’t tell us that Bublik’s drop shot is good, but it does make the tactic look more viable. We’re assuming that in the aggregate, all shot opportunities with the same profile (i.e. second-serve point, ball to the backhand for the fifth shot of the rally) are about the same. That’s just an approximation, so a gap of one percentage point could occur because Sasha chooses lower-percentage moments to hit the drop. There’s even a sliver of evidence that he does so: Eight of his charted drop shots are backhands on the seventh shot of the rally or later of his own first-serve points. Those sound like desperate efforts to finish a point he’s given up on, and sure enough, he lost all eight. Take those out of the equation, and his win percentage on drop shots is exactly the same as when he hits something else.

    Drops in expectation

    Go through the same exercise for every player, and the drop-shot leaderboard takes on a different look.

    Some players, like Kei Nishikori and Nicolas Jarry, win a very high percentage of drop shot points and exceed expectations by a wide margin. Others, like Alcaraz, see less of a benefit from their drop shot, in part because their other options are so good. Still others, like Daniil Medvedev, win more than half of drop-shot points, but because of the rest of their game and the moments they choose to deploy the drop, they may be sacrificing some points when they do so.

    Call the new stat Drop Shot Wins Over Expectation, or DSWOE: the ratio of drop-shot success rate to non-drop-shot winning percentage, taking into account the situations in which the player chooses the drop.

    Among the 60 players with the most charted points since 2015, here’s the top of the list–the men who gain the most per drop shot–along with a few notable names in Bublik’s section of the list, plus the most extreme laggards:

    Player                       Drop W%  Exp W%  DSWOE  
    Nicolas Jarry                  65.3%   50.4%   1.30  
    Lucas Pouille                  60.3%   48.1%   1.25  
    Kei Nishikori                  68.1%   54.5%   1.25  
    Sebastian Baez                 63.2%   50.9%   1.24  
    Richard Gasquet                60.7%   50.0%   1.22  
    Kevin Anderson                 53.8%   44.6%   1.21  
    Reilly Opelka                  52.1%   43.5%   1.20  
    Marton Fucsovics               58.2%   49.5%   1.18  
    Alejandro Davidovich Fokina    59.3%   50.7%   1.17  
    Roger Federer                  59.5%   51.4%   1.16  
    Robin Haase                    54.7%   47.8%   1.14  
    Frances Tiafoe                 54.6%   48.0%   1.14  
    Pablo Carreno Busta            58.9%   52.2%   1.13  
    Dominic Thiem                  57.1%   50.7%   1.13  
    Carlos Alcaraz                 62.1%   55.7%   1.12  
    Rafael Nadal                   61.5%   55.4%   1.11  
    Andy Murray                    55.7%   50.5%   1.10  
    …                                                    
    Holger Rune                    51.4%   51.3%   1.00  
    Grigor Dimitrov                47.7%   47.9%   0.99  
    Alexander Bublik               45.4%   46.5%   0.98  
    Daniil Medvedev                53.0%   54.8%   0.97  
    Novak Djokovic                 50.8%   52.9%   0.96  
    …                                                    
    Stan Wawrinka                  45.3%   48.9%   0.93  
    Milos Raonic                   38.0%   41.3%   0.92  
    Benoit Paire                   42.9%   46.8%   0.92  
    Tommy Paul                     47.0%   51.5%   0.91  
    Aslan Karatsev                 39.0%   49.9%   0.70

    Surrounded by names like Rune and Djokovic, Bublik doesn’t seem so bad. Alcaraz, on the other hand, doesn’t stand out as much. He and list-neighbor Rafael Nadal are outrageously good in rallies whether they hit a drop shot or not. Even a world-class drop shot is only so much better than a standard Rafa or Alcaraz topspin groundstroke.

    Tour average is around 1.05, meaning that the typical player does a bit better when they hit a drop shot than they would have had they chosen a different shot in the same situation. That tells us something that we probably suspected: Players are generally good at choosing the right moment to unleash the drop.

    With this more fine-grained notion of expectations, we can re-calculate the number of points per thousand that each player gains or loses from drop shots. It is a function of both success rate (relative to expectations) and frequency. Nishikori and Jarry get great results from the drop but employ it rarely; men like Alcaraz and Sebastian Baez gain more points overall because they hit droppers so much more often.

    Here are the players who gain the most points, along with the five tour regulars at the bottom of the list:

    Player                       Freq%  W% - Exp%  DPOE/1000  
    Sebastian Baez                3.9%      12.3%        4.8  
    Alejandro Davidovich Fokina   5.2%       8.5%        4.5  
    Lucas Pouille                 2.9%      12.2%        3.5  
    Carlos Alcaraz                5.4%       6.4%        3.4  
    Richard Gasquet               2.8%      10.8%        3.0  
    Robin Haase                   3.9%       6.9%        2.7  
    Kei Nishikori                 2.0%      13.6%        2.7  
    Frances Tiafoe                3.2%       6.6%        2.1  
    Pablo Carreno Busta           2.8%       6.7%        1.9  
    Nicolas Jarry                 1.2%      14.9%        1.8  
    Fabio Fognini                 3.7%       4.7%        1.8  
    Andy Murray                   3.3%       5.2%        1.7  
    Dominic Thiem                 2.6%       6.4%        1.7  
    Marton Fucsovics              1.9%       8.7%        1.7  
    Roger Federer                 2.0%       8.1%        1.6  
    …                                                         
    Novak Djokovic                3.3%      -2.1%       -0.7  
    Alexander Bublik              7.2%      -1.0%       -0.8  
    Lorenzo Musetti               5.1%      -2.3%       -1.2  
    Aslan Karatsev                1.2%     -10.9%       -1.3  
    Benoit Paire                  5.4%      -3.9%       -2.1

    Five (or 4.8) points per thousand might not sound like a lot, but it represents the difference between Baez having a place in the top 20 and residing well outside of it. Alcaraz still grades well here, if not as much as he did before making all of the adjustments. Bublik scores closer to neutral too. His drop shot is probably more useful for earning him highlight-reel screentime than it is for winning points, but it isn’t hurting him that much.

    Side matters

    Armed with these adjustments, we can compare each player’s forehand and backhand drop shots, as well. Bublik has a fairly wide split. He wins just over 50% of points when he hits a forehand drop shot, next to only 39% behind a backhand drop shot. His expectations when faced with a backhand are worse in general, but not that much worse. His forehand drop shot success rate is two percentage points better than if he went with a standard groundstroke, while his backhand drop shot is five points worse.

    So Sasha, if you’re reading this: We all love your drop shots. But maybe take it easy with the backhands.

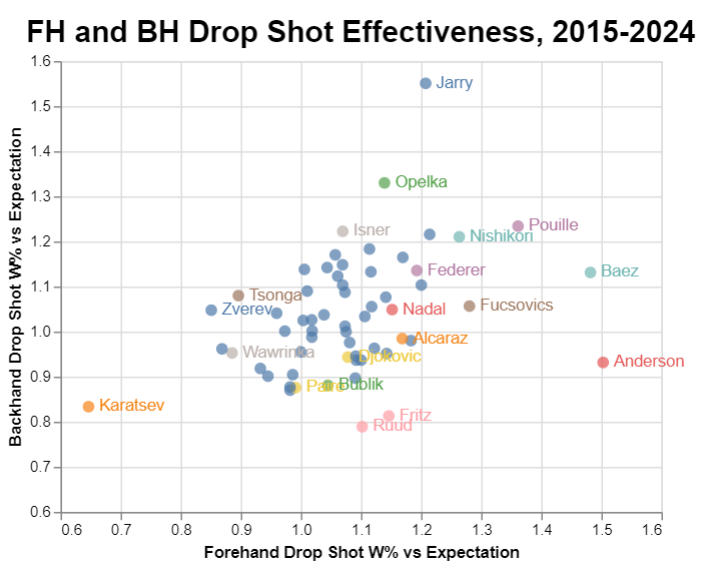
    The best forehand drop shots, compared to how the player would have fared with a different shot, belong(ed) to Kevin Anderson, Sebastian Baez, Lucas Pouille, Marton Fucsovics, and Nishikori, with Roger Federer not far behind. The most effective backhand droppers are those of Jarry, Reilly Opelka, Pouille, John Isner, and Richard Gasquet. “Expectations” is the key word for Opelka and Isner: They didn’t win a lot of points once a rally was underway, so a moderately good drop scores very well by comparison.

    Here is the field of 60 regulars from the last decade. As usual, top right is good, bottom left is… yikes, Aslan Karatsev.

    There are innumerable way to divide these numbers even further, and I know you’re tempted. But with drop shots, there is only so much data. Some of the outliers here, like Jarry and Anderson, are probably a bit aided by luck. Men who don’t hit many drop shots might only have a few dozen attempts on their weaker side. The standouts probably are better than average, but limits of our data lead us to overstate their advantage.

    At least with the forehand/backhand division, adjusted for how players would have fared with something other than a drop shot, we can get some hints as to how our faves can improve their games. Taylor Fritz has a strong backhand, and I doubt the points he’s losing with his backhand drop shot are making it any more effective. Alexander Zverev isn’t doing himself any favors with his occasional forehand droppers. Karatsev, well… not everyone can excel at everything.

    Bublik, despite his negative numbers in the aggregate, has an effective forehand drop shot. With the power of his serve and forehand, he’ll continue to earn plenty of opportunities to use it. If he resists the urge to showboat on his backhand side, the court jester of the drop shot could continue to show off his touch and still earn a more coveted position in the tactic’s royal house.

    * * *

    Subscribe to the blog to receive each new post by email:


    Effects and After-Effects of the Carlos Alcaraz Drop Shot

    Also today: Wild cards and doping bans; Miami preview podcast

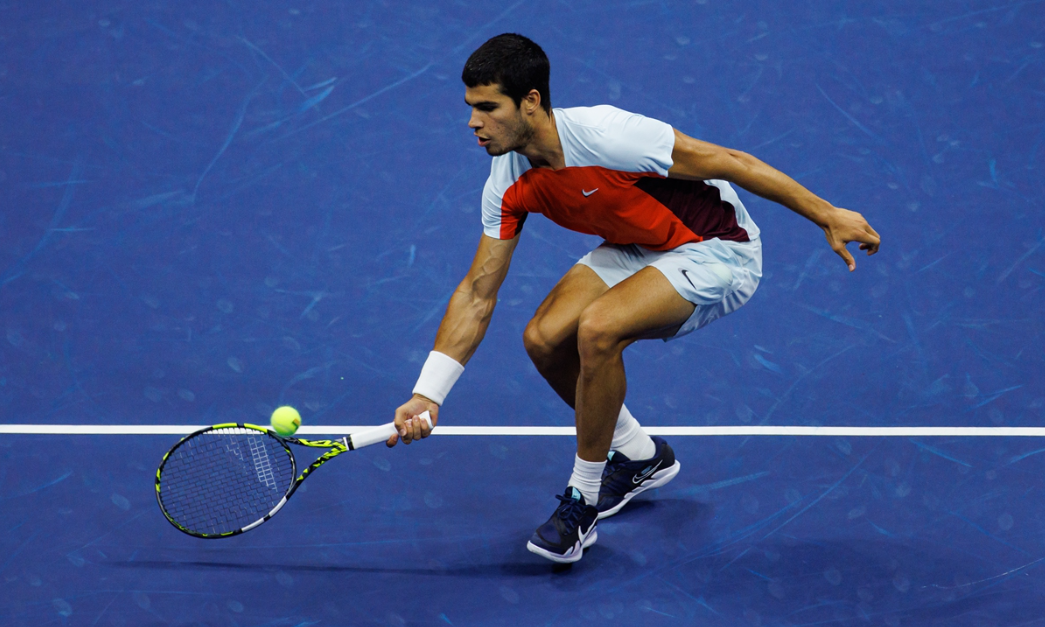
    Carlos Alcaraz in the 2022 US Open final

    It is not easy to analyze the drop shot. Players don’t hit it very often, they sometimes hit it from very favorable or very unfavorable circumstances, and the goal of the shot sometimes extends beyond winning the point at hand. We can point to someone who hits droppers well and seems to win a lot of points doing so, but how much is the skill really worth?

    Carlos Alcaraz is the poster boy for the modern drop shot. He loves to hit it–possibly too much–and when he executes, it’s one of the most stunning shots in tennis. At the business end of his Indian Wells campaign last week, he went to the well seven times against Alexander Zverev, ten times against Jannik Sinner, and three more in the final against Daniil Medvedev. He won 11 of those 20 points. That doesn’t sound so impressive, but Alcaraz could hardly complain about the end result.

    To get a grip on drop shot numbers, we have a lot of work to do. What is a good winning percentage? Do any players suffer because they hit the drop shot too much? Is there a lingering effect from disrupting your opponent’s balance? Finally, once we have a better idea of all that, how does Alcaraz stack up?

    Drop shot basics

    To keep the data as clean as possible, let’s be specific about which strokes we’re looking at. While one can hit a drop shot in response to another drop shot (a “re-drop”), and it’s possible to hit a drop shot from the net in reply to a short volley or half-volley, those aren’t typically what we’re referring to. There are probably players (starting with Alcaraz!) who are better at that sort of thing than their peers, but those low-percentage recoveries aren’t today’s focus.

    In this post, when I say “drop shot,” I mean a drop shot from the baseline, excluding all shots from the net, including responses to earlier drops.

    The Match Charting Project gives us over 4,600 men’s matches to work with since 2015. Those 750,000 points include almost 35,000 drop shots. That works out to a drop shot in about 4.6% of points. Or from the perspective of a single player, it’s 2.3%, 1 out of every 44 points. The player who hits the drop shot ends the point immediately (via winner or forced error) about one-third of the time, and 19% of the droppers miss for unforced errors. Overall, the player who hits the drop shot wins the point 53.8% of the time.

    From the 60 players with the most charted points to analyze, here are the 15 who win the highest percentage of points behind their drop shots:

    Player                       Drop Point W%  
    Kei Nishikori                        69.6%  
    Richard Gasquet                      66.2%  
    Nicolas Jarry                        65.3%  
    Sebastian Baez                       63.2%  
    Carlos Alcaraz                       62.1%  
    Rafael Nadal                         61.3%  
    Lucas Pouille                        60.3%  
    Roger Federer                        59.7%  
    Alejandro Davidovich Fokina          59.3%  
    Roberto Bautista Agut                58.9%  
    Marton Fucsovics                     58.2%  
    Pablo Carreno Busta                  58.1%  
    Jannik Sinner                        57.7%  
    Dominic Thiem                        57.5%  
    Andy Murray                          56.7%

    Alcaraz does well here! Despite the presence of Kei Nishikori at the top, the list is heavily skewed toward clay-courters. Drop shots are a more central tactic on clay than on other surfaces, which works in both directions: Clay-courters are more likely to develop good drop shots, and players who have dangerous droppers are more likely to succeed on dirt.

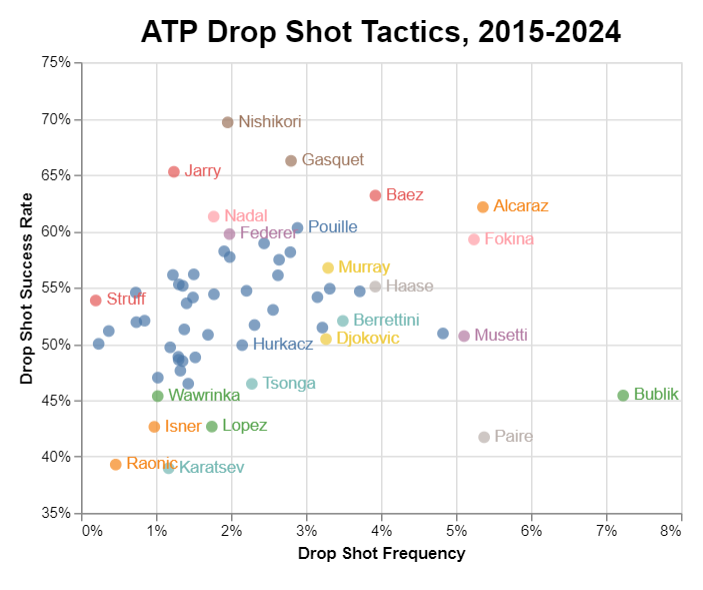
    Another skill that contributes to a spot on the list is good judgment. Nicolas Jarry doesn’t hit many drop shots, so he is probably picking the ripest opportunities when he does. There’s almost zero correlation between frequency of drop shots and drop shot success rate. Call it the Bublik Rule. From the same group of 60 tour regulars, here are the top 15 ranked by frequency:

    Player                       Drop/Pt  Drop Point W%  
    Alexander Bublik                7.2%          45.4%  
    Benoit Paire                    5.4%          41.7%  
    Carlos Alcaraz                  5.4%          62.1%  
    Alejandro Davidovich Fokina     5.2%          59.3%  
    Lorenzo Musetti                 5.1%          50.7%  
    Holger Rune                     4.8%          50.9%  
    Sebastian Baez                  3.9%          63.2%  
    Robin Haase                     3.9%          55.1%  
    Fabio Fognini                   3.7%          54.7%  
    Matteo Berrettini               3.5%          52.0%  
    Nick Kyrgios                    3.3%          54.9%  
    Andy Murray                     3.3%          56.7%  
    Novak Djokovic                  3.3%          50.4%  
    Botic van de Zandschulp         3.2%          51.4%  
    Frances Tiafoe                  3.2%          54.1%

    Bublik may be turning things around: In the Montpellier final last month, he attempted 18 droppers and won the point 14 times. For a consistent high-frequency, high-success combination, though, we’re back to Alcaraz. Only Carlos, Alejandro Davidovich Fokina, Sebastian Baez, and Andy Murray (barely) appear on both lists.

    Here are all 60 players in graph form. The top right corner shows players who hit a lot of drop shots and win most of those points. The closer to the bottom, the lower a player’s success rate; the closer to the left, the fewer droppers he attempts:

    As a percentage of all points played, Bublik wins the most behind his drop shot. But it comes at a cost, since he hits so many of them, often sacrificing points because of it. If we assume that each drop shot is struck from a precisely neutral rally position, meaning that the would-be dropshotter has a 50% chance of winning the point, Bublik is losing points by going to the drop shot so often.

    That’s a big assumption, and it probably isn’t exactly true for Bublik, or for anyone else. But if we stick with that for a moment, we can combine frequency and success rate into one number. Take the difference between success rate and 50% (that is, the gain or loss by opting for a drop shot), multiply that by frequency, and you get the percent of total points that the player wins by choosing the drop. The resulting numbers are small, so here’s the top ten (and bottom five) list showing points gained or lost per thousand:

    Player                       Drop Pts/1000  
    Carlos Alcaraz                         6.5  
    Sebastian Baez                         5.2  
    Alejandro Davidovich Fokina            4.9  
    Richard Gasquet                        4.5  
    Kei Nishikori                          3.8  
    Lucas Pouille                          3.0  
    Pablo Carreno Busta                    2.3  
    Andy Murray                            2.2  
    Roberto Bautista Agut                  2.2  
    Rafael Nadal                           2.0  
    …                                           
    Jo Wilfried Tsonga                    -0.8  
    Feliciano Lopez                       -1.3  
    Aslan Karatsev                        -1.3  
    Alexander Bublik                      -3.3  
    Benoit Paire                          -4.5

    Reduced to one number, Alcaraz is our dropshot champion. Six points per thousand doesn’t sound like a lot, but to invoke the familiar refrain, the margins in tennis are small. Beyond the top five or ten players in the world, one single point per thousand is worth one place on the official ranking list. Stars of Alcaraz’s caliber are separated by wider gaps, but it’s still a useful way to gain some intuition about the impact of these apparently miniscule differences.

    The after-effect

    In the hands of someone like Carlitos, the drop shot is a reliable way to win points. But the impact can go further than that. All sorts of tactics–drop shots, underarm serves, serve-and-volley–can theoretically be justified by some longer-term effect. If your opponent is camped out six feet behind the baseline and you want him somewhere else, a drop shot will surely give him something to think about.

    This is hard to quantify, to put it mildly. How long does the effect of a drop shot last? Does it decay after each successive point? Does it disappear at the end of a game? On the next changeover? Ever? Jarry might need to hit the occasional drop shot to remind his opponent that he can do it, but Alcaraz doesn’t even need to do that. Everybody knows he’ll dropshot them, so he’s probably in his opponent’s head even before he hits the first drop shot of a match.

    The evidence is unclear. About two-thirds of drop shots are hit by the server. I looked at the results of points immediately after a point with a drop shot, points two points later, and all the points that followed within the same game. When the server hits the drop shot, his win percentage on those subsequent points is worse than his win percentage on other points throughout the match–that is, non-dropshot points that didn’t follow so closely after he played a dropper:

    Situation          Win%  
    Next point        63.3%  
    Two points later  62.6%  
    Same game         62.5%  
    All others        64.2%

    I suspect that the dropshot effect (if there is one) is swamped by all the other influences at work here. Droppers typically occur in longer rallies, which might tire the server. The server might go for a drop shot when he runs out of ideas, another thing that might go through his mind as he prepares for the next point. This seems to work against Alcaraz more than other servers:

    Situation          Win%  
    Next point        62.0%  
    Two points later  62.1%  
    Same game         63.2%  
    All others        65.0% 

    The same pro-returner bias appears when we look at the results when it is the returner who goes for the drop shot. After seeing the numbers above, it’s tough to say that hitting a drop shot causes the higher success rate on subsequent points, but it is nonetheless a striking effect, especially for Carlitos:

    Situation      Alcaraz W%     Tour W%  
    Next point          44.0%       38.3%  
    Two points later    41.8%       37.6%  
    Same game           41.5%       37.9%  
    All others          40.1%       35.8%

    Whatever the mechanism here, it goes beyond “drop shot good, opponent confused.” More research is needed, and camera-tracking data would help.

    Regardless of the after-effects (or lack thereof), the stats support the common contention that Alcaraz possesses a world-class drop shot. He might use it too often in some matches, and certainly there are individual situations in which he should have done something else. In the aggregate, though, the tactic is working for him. It produces more value than any other player’s dropper has done in the last decade. Tennis analytics is hard, but goggling at the game of Carlos Alcaraz is easy.

    * * *

    Wild cards and doping suspensions

    Simona Halep returned to action this week, thanks to a Miami wild card granted immediately after her doping suspension was reduced. Halep is well-liked, and there were few objections to her appearance in the draw. But Caroline Wozniacki, while careful to say she wasn’t specifically targeting Halep, said that she was against dopers getting post-suspension wild cards.

    We’ve done this before. In 2017, Maria Sharapova returned from 15-month ban and immediately got a wild card to enter Stuttgart. The tennis world spent a few weeks in a dither about whether she’d get one to the French Open, too. She didn’t.

    I wrote about the Sharapova situation at the time. I argued that Sharapova ought to get those opportunities. The reason I gave at the time was that it was better for the sport: She was one of the best players in the game, and fields would be more competitive with her than without her. Another reason is that without wild cards, it’s a long road back. Unranked after more than a year on the sidelines, a player needs to enter qualifying at ITFs, wait two weeks for those points to go on the official rankings (assuming they win!), and then use those rankings to enter (slightly) stronger events, with entry deadlines several weeks in advance of the tournaments themselves.

    Climbing back up the ladder can take months. Is that part of the penalty? Is a 15-month suspension supposed to be 15 months of no competition, followed by 3-6 months of artificially weak, poorly remunerated competition? In team sports, this isn’t an issue, because coaches can put returning players in the lineup as soon as they’re ready.

    As usual, the problem is that tennis doesn’t have unified governance. None of the various bodies in charge have an applicable policy. Sharapova was fine, and Halep will be fine, because stars get wild cards (if not as many as they would like), while lower-ranked players are stuck heading to Antalya to rack up ITF points. The discrepancy is particularly glaring in a case like that of Tara Moore, who missed 19 months but has been fully exonerated.

    The WTA is apparently considering granting special rankings to players who have been cleared of doping charges or had their bans reduced, essentially treating them as if they are returning from injury. That’s better than nothing, but it wouldn’t address the more common scenario illustrated by Sharapova’s return.

    I would go further and grant special rankings to any player returning from suspension. The term of the suspension is the penalty, period. Even better, and fairer to the field as a whole: Grant those special rankings in combination with a policy that restricts wild cards. For instance, Halep could have eight or ten entries into tournaments on the basis of her pre-suspension ranking, but no wild cards for her first year back. That way, individual tournament directors don’t need to re-litigate each doping ban, players have a predictable path to follow post-suspension, and superstars aren’t given any special advantages.

    * * *

    Miami preview podcast

    I had a fun conversation yesterday with Alex Gruskin, talking about my recent Iga Swiatek piece and previewing the men’s and women’s draws in Miami. Click here to listen.

    * * *

    Subscribe to the blog to receive each new post by email:


    Jelena Ostapenko In the Hands of Fate

    Also today: Deciding tiebreaks, a MCP milestone, and assorted links.

    Jelena Ostapenko in 2023. Credit: Hameltion

    If you’ve ever spent five minutes watching Jelena Ostapenko play tennis, you know she’s as aggressive as it gets. She swings for the fences and sometimes knocks them over. Get her on a hot streak, and opponents can only hope its ends before the handshake. When she’s off her game, spectators in the first few rows duck for cover.

    What you might not realize is just how aggressive she is. A few years ago I tuned Lowell West’s Aggression Score metric so that the numbers fell in a range between 0 and 100. In theory, 0 is maximally passive; 100 is go-for-broke, all the time. Ostapenko’s career Aggression Score in rallies is 175.

    This sort of extreme style lends itself to all sorts of narratives. She can beat anybody, any time, as she showed when she won the 2017 French Open as an unseeded player, and again last year when she upset Iga Swiatek at the US Open–her fourth win in as many matches against the Pole. That makes her a perennial dark horse pick at majors. Even though she hasn’t reached a semi-final since 2018, neither Iga nor Coco Gauff–who exited the Australian Open after an Ostapenko barrage last year–would like her find her in their section.

    (Sorry Iga: Guess who you might face in the quarters!)

    Hyper-aggressive players also appear to be works in progress. Especially early in Ostapenko’s career, commentators would talk about her stratospheric potential if she could only improve her footwork, or play a bit more “within herself.” That is, not quite so many winners, not quite so soon, more point construction, fewer unforced errors. But players rarely change much, and as they age, they are more likely to become more aggressive, not less. The Latvian is now 26 years old, beginning her ninth year on tour. What you see is what you get.

    What you get, it turns out, is a lot of close matches. Ostapenko played 30 three-setters last year, including four in a row to reach the Birmingham final and another four straight to start the US Open. Alona’s apotheosis came at Indian Wells, when she faced fellow super-aggressor Petra Kvitova in the third round. Both women tallied exactly 75 points; Kvitova won, 0-6, 6-0, 6-4. Tennis ball fuzz could be seen floating over the desert for days afterward.

    That particular scoreline was an oddity, but the margin of victory was not. Ostapenko’s tight matches are not a result of streakiness, flightiness, or anything of the sort. They are an unavoidable function of her game style. It’s almost impossible to hit lots of winners without also committing piles of unforced errors. (We’ll come back to that.) When you do both in such numbers, you personally account for a substantial majority of point outcomes. The winners and errors (very approximately) balance each other out, and unless your opponent does something remarkable–or remarkably bad–with the limited influence you leave her, you end up winning about half the points played.

    No one takes the racket out of an opponent’s hand like Ostapenko does. Once the return is in play, the Latvian ends nearly two-thirds of points herself, with a winner or unforced error, or by forcing an error. No one else comes close. Drawing on Match Charting Project data, I’ve listed the active players who end the most rallies:

    Player                 RallyEnd%  
    Jelena Ostapenko           65.9%  
    Petra Kvitova              61.6%  
    Madison Keys               60.8%  
    Liudmila Samsonova         60.0%  
    Camila Giorgi              59.7%  
    Aryna Sabalenka            59.7%  
    Veronika Kudermetova       57.5%  
    Danielle Collins           57.5%  
    Ekaterina Alexandrova      57.2%  
    Ons Jabeur                 56.8%  
    Peyton Stearns             56.5%  
    Caroline Garcia            56.2%  
    Naomi Osaka                56.2%  
    Varvara Gracheva           55.0%  
    Iga Swiatek                55.0%

    Here’s another way to look at Alona’s extreme position on this list. The only other woman to grade out so far from 50% is Madison Brengle, who ends fewer than 34% of rallies. Ostapenko’s power turns the rest of the tour into Brengle.

    Give and take

    Ending even 57% of points on your own racket requires a lot of big swings. When you aim for a line, you might feel confidence about your chances, but you are taking a risk. A few players, like Swiatek, can generate winners without paying the unforced-error penalty, but that takes an unusual combination of patience and power that most players do not possess.

    The 66% of points that Ostapenko ends on her own racket divides into roughly 37% winners (and forced errors) and 29% unforced errors. That’s worse than Aryna Sabalenka, who hits nearly as many winners with only a 23% error rate, but compared to the tour as a whole, the ratio is a solid one. For every unforced error she commits, she ends 1.25 points in her favor. Average among players represented in the Match Charting Project is 1.16, and the true mean is probably lower than that, since the MCP is more heavily weighted toward the best players.

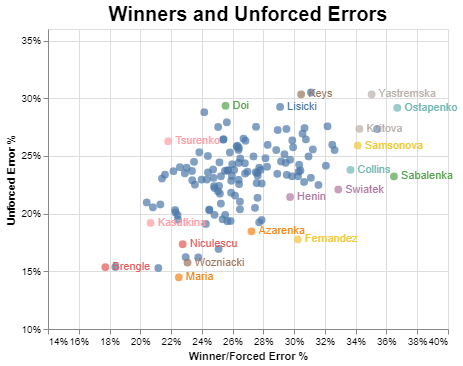
    The ratio varies among players, but there is a fairly strong relationship. Here are the winner/forced error and unforced error rates–each as a percentage of all points where the return came back in play–for 140 current and recent players:

    The correlation between the two rates (r2 = 0.3) would be even stronger if it weren’t for net-rushers like Tatjana Maria–and to some extent Leylah Fernandez–who force their passive opponents into more aggression than they would otherwise produce.

    As Sabalenka shows, it’s possible to seize as many points as Ostapenko does without giving quite so many away, but even that may be a mirage: Sabalenka racks up winners behind an overpowering serve that the Latvian can’t match. If the plot above is any indication, it would be difficult to bring her error rate down without also sacrificing some winners, not to mention the élan that she has ridden to seven tour-level titles.

    So we’re left with something of a paradox. A hyper-aggressive player has more control over her fate than her peers do, but that control comes at a cost of a towering error rate, which keeps matches close. One result is a week like this one in Adelaide, where Ostapenko has reached the final by slipping through perilously tight battles with Sorana Cirstea (51.7% of points won) and Caroline Garcia (50.2%). Both matches could’ve gone the other way, something that is true so often when the Latvian steps on court. My tactical advice for Daria Kasatkina in tomorrow’s final: Cross your fingers.

    * * *

    Deciding-set tiebreak records

    AbsurDB asks:

    [A]m I right that Hurkacz’s 15 deciding sets going into tie-breaks in one calendar year is a historical record in ATP (10 such tie-breaks won is also probably a record?)?

    Indeed, both are records. According to my data, the previous records came from Ivo Karlovic’s 2007 season, when he reached 11 deciding-set tiebreaks, winning eight of them. Here are all the player-seasons with nine or more.

    Player              Season  Dec TB  Record  
    Hubert Hurkacz        2023      15    10-5  
    Ivo Karlovic          2007      11     8-3  
    John Isner            2011      11     4-7  
    John Isner            2018      11     6-5  
    Ivo Karlovic          2014      10     7-3  
    John Isner            2017      10     5-5  
    Kevin Anderson        2018      10     6-4  
    Mark Philippoussis    2000       9     5-4  
    Marat Safin           2000       9     5-4  
    Ivan Ljubicic         2002       9     2-7  
    Ivan Ljubicic         2007       9     8-1  
    Ivo Karlovic          2008       9     5-4  
    Sam Querrey           2018       9     1-8  
    Borna Coric           2019       9     6-3  
    Hubert Hurkacz        2022       9     3-6

    (Yes, I checked before 2000, as well, but no one reached nine until Philippousis did so that year. The first player-season with eight deciding-set tiebreaks was Tom Gullikson’s, in 1984.)

    * * *

    MCP Milestones

    Earlier this week, the Match Charting Project recorded its two-millionth point:

    The milestone match was the Auckland second-rounder between Ben Shelton and Fabian Marozsan, which I charted as a warm-up for my article on Wednesday. We’re not resting on our laurels, of course: We’ve added another five matches (and 800 or so points) in the 48 hours since.

    Also worth mentioning is another round number we reached in the offseason: 1,000 different ATP players. Apart from the name syou’d expect, it’s a healthy mix of lower-ranked active players and former tour regulars. #1,000 was Martin Jaite, via his 1987 Rome final against Mats Wilander. We’ve also now charted 800 different WTAers.

    We stand about 200 charts away from 13,000 matches overall: approximately 7,000 men’s and 6,000 women’s. 2023 was our most productive year yet, and 2024 would be a great time to start contributing.

    * * *

    Assorted links

    • Earlier this week I appeared on Alex Gruskin’s Mini-Break Podcast, in which he got overexcited about a number of week one trends, and I tried to talk him down from all the ledges.
    • I wrote about how GPT4 helped me make Tennis Abstract’s new navbar, because you had to know I didn’t do it myself.
    • The tours have introduced a new policy on late matches. I’m underwhelmed: There are an awful lot of exceptions, and there’s no acknowledgement of the underlying problem of longer and longer matches.
    • Two student projects worth a look: Pramukh’s Evaluating Tennis Player Styles in Relation to Tour Averages, based on MCP data, and Amrit’s Aces over Expected model.
    • If you can’t wait until Sunday for grand slam tennis, here’s the Clijsters-Henin 2003 US Open final.

    * * *

    Subscribe to the blog to receive each new post by email:


    Angelique Kerber in the New World

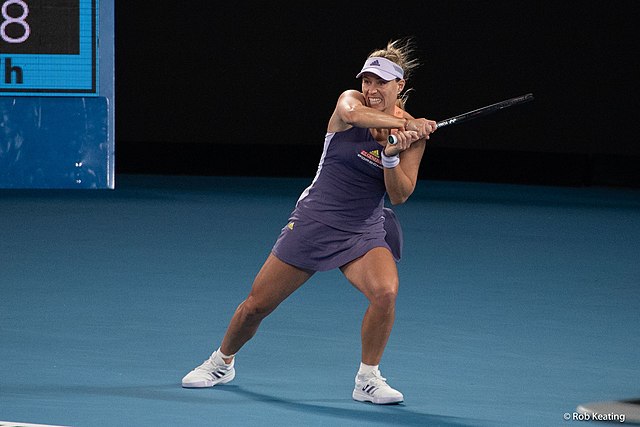
    Angelique Kerber in 2020. Credit: Rob Keating

    Angelique Kerber’s return to the tour has, so far, been a rocky one. She began Germany’s United Cup campaign with a narrow defeat to Jasmine Paolini, in which the Italian earned 21 break points against the German’s serve. Kerber took a set from the free-swinging Caroline Garcia but lost in three. Today, Maria Sakkari blew her off the court, winning nine games in a row before Kerber got on the board and split the remaining six.

    The United Cup, in its new design, is not an easy place to make a comeback: The German faced top-30 players all three rounds. (Compare that to the tour event in Brisbane, where fellow returnee Naomi Osaka scored an opening-round victory against a player ranked 83rd.) Kerber surely didn’t expect to dominate immediately. It’s hard to get rolling again after an 18-month layoff, and she hasn’t been a truly elite player since early 2019. She turns 36 years old this month, a tough age even for players with three majors to their credit.

    The Garcia match, in particular, highlighted another dimension of the challenge. The tour that Kerber rejoins is different from the one where she collected so many laurels. Angie is the very definition of a counterpuncher, a clever defender who uses anticipation and racket control to convert her opponent’s pace into winners of her own. It’s tough to counterpunch against someone like Garcia, who aims to end the point with nearly every shot.

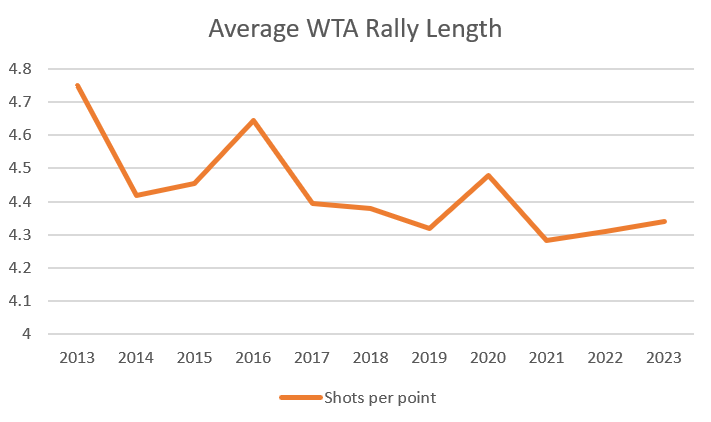
    The reckless Frenchwoman is hardly alone. Based on data from the Match Charting Project, here is the average rally length on the WTA tour since 2013:

    It looks a bit fluky, but it’s noteworthy to find a peak in 2016, Kerber’s best year. Rally length has been essentially flat since 2021, perhaps since 2019 if we set aside the Covid-affected 2020 season. The German is plenty familiar with the landscape, having competed on tour until Wimbledon in 2022, but she developed her game back when the power of Serena Williams was an outlier. Now, Serena’s late-career bashing is the model for a new generation.

    There are a number of ways to illustrate the trend. While the year-to-year differences are minor, the arrows all point in the same direction. In 2016, 49.6% of points were decided in three shots or less. Last year, it was 53.0%. (In 2021 and 2022, it was a bit higher still.) At Kerber’s peak, nearly 24% of points lasted at least seven strokes. Last year that figure had declined to 20.8%.

    This is probably worse news for someone like Caroline Wozniacki than it is for Kerber. Woz keeps points alive and waits for errors, skills that Garcia (or Aryna Sabalenka, or Elena Rybakina, or dozens more players she might draw in the first round of the Australian Open) render meaningless. While Angie isn’t going to pile up aces–she’s hit a grand total of two in three United Cup matches–she is fully capable of redirecting a serve for a return winner, as she did a couple of times against Sakkari. Still, the shorter the point, the less likely that Kerber finds an opportunity to work her magic.

    Throughout her career, the German lefty has rarely had a problem picking spots to end points with winners or forced errors. Match Charting data shows that 6% of her groundstrokes go for winners, right in line with tour average.

    The catch, though, is when she hits them. Kerber is one of 58 players for whom the Match Charting Project has recorded at least 2,000 winners and forced errors since 2013. Only four of those players unleash their winners later in the rally. The average shot number of Kerber’s point-enders is 4.9–bad news in an era when nearly two-thirds of points are finished in four shots or less.

    Here are the twelve players in the dataset whose winners occur latest in the rally:

    Player                Avg Winner Shot#  
    Daria Kasatkina                    5.1  
    Viktorija Golubic                  5.0  
    Yulia Putintseva                   5.0  
    Carla Suarez Navarro               4.9  
    Angelique Kerber                   4.9  
    Sloane Stephens                    4.9  
    Agnieszka Radwanska                4.9  
    Simona Halep                       4.8  
    Svetlana Kuznetsova                4.7  
    Anastasija Sevastova               4.6  
    Caroline Wozniacki                 4.6  
    Su Wei Hsieh                       4.6

    This isn’t a table where you want to find your name north of Wozniacki’s. It’s possible to survive on today’s tour playing this way, as Daria Kasatkina has proven, but it is much less likely to translate into a major title. Wimbledon champ Marketa Vondrousova didn’t miss the list by much, coming in at 4.4, but her aggression varies wildly from one match to another. Iga Swiatek and Coco Gauff appear closer to the middle of the pack, at 4.2, and Aryna Sabalenka ranks as the fourth most aggressive of the 58, at 3.4.

    At the risk of belaboring the point, here’s another way of seeing the difference between Angie’s style and the brands of tennis that currently top the rankings. The following chart shows what percent of Kerber’s winners (and forced errors) happen at each point in the rally, compared to the same figures for Swiatek and Sabalenka:

    The “1st shot” and “6th+” columns are virtual mirror images of each other. Even that understates the difference between the veteran and the two youngsters, because a point-ending serve from Kerber is more likely to be at least partially the fault of the returner–those errors are conventionally scored as forced regardless of the strength of the serve.

    I don’t want to say that Kerber can’t succeed on her return to the circuit, but it’s clear that she faces a challenge. The tennis world of the mid-2010s is long gone, and even if she regains the form that took her to number one in 2016, it may not give her the same results in 2024. A new era requires a new Angie; we’ll see if she can produce one.

    * * *

    Subscribe to the blog to receive each new post by email:


    Hubi’s Three-Set Magic

    Also today: Torben Ulrich (1928-2023); What is this?

    Hubert Hurkacz: Let’s play three!

    Hubert Hurkacz started the 2024 season right where he left off. In the round-robin stage of the United Cup, he played two singles matches, beating Thiago Seyboth Wild and losing to Alejandro Davidovich Fokina. Both matches went to a third set.

    No one played more deciding third sets in 2023 than Hurkacz. Out of 55 best-of-three starts, he went the distance 32 times. That’s more three-setters–and a higher rate of them (58%)–than any player-season this century. On average, about 35% of ATP matches go three. Since 2000, only 16 players have posted a full season where they went to a third set more than half the time.

    This is new territory for the 26-year-old from Poland. He reached a decider in only 35% of his three-setters in 2021, then increased that clip to 45% in 2022. The main difference between his 2022 and 2023 seasons was that his already small margins shrunk even further. He won matches at almost the same rate both years, even though he broke a bit less often and was less effective with his second serve in 2023. He converted his three-setters at exactly the same rate (62.5%) in both seasons. Hurkacz’s edge was still enough to keep him in the top ten, but only because he was willing to play so much tennis.

    It’s a bit fluky to pile up so many three-setters, but we can get a hint at some trends by looking at the list of similar warriors:

    Year  Player                  Bo3  Deciders   Dec%  
    2023  Hubert Hurkacz           55        32  58.2%  
    2018  John Isner               40        23  57.5%  
    2022  Taylor Fritz             55        31  56.4%  
    2010  John Isner               48        27  56.3%  
    2019  Nikoloz Basilashvili     43        24  55.8%  
    2014  Guillermo Garcia Lopez   42        23  54.8%  
    2019  Fernando Verdasco        42        23  54.8%  
    2018  Robin Haase              46        25  54.3%  
    2009  Julien Benneteau         48        26  54.2%  
    2005  Jurgen Melzer            39        21  53.8%  
    2007  Dmitry Tursunov          41        22  53.7%  
    2017  Jack Sock                51        27  52.9%  
    2011  Stan Wawrinka            40        21  52.5%  
    2013  John Isner               52        27  51.9%  
    2017  Albert Ramos             54        28  51.9%  
    2018  Joao Sousa               45        23  51.1%  
    2000  Fernando Vicente         47        24  51.1%  
    2013  Robin Haase              49        25  51.0%  
    2003  Gaston Gaudio            55        28  50.9%  
    2006  Dmitry Tursunov          61        31  50.8%

    There are plenty of clay-court grinders on the list; that doesn’t really apply to Hubi. What pops out to me are the three appearances of John Isner. While Hurkacz isn’t as one-dimensional as Big John, he has the same sort of profile. Only four other players in the current top 50–none of them in the top 15–break serve as rarely as he does. When breaks are scarce, sets go to tiebreaks and matches go three. An incredible 14 of Hubi’s 32 three-setters went to a sudden-death tiebreak. He won ten of them.

    None of this is sustainable. In one sense, that’s bad news: If Hurkacz somehow lands in 14 more deciding-set tiebreaks this year, he’ll end up closer to 7-7 than 10-4. On the other hand, three-set stats are just trivia–exhausting trivia, at that. There wasn’t much to separate his top-line 2022 and 2023 results, and he’s surely be happy with another top-ten finish regardless of whether he needs to play 30-plus deciding sets to get there.

    If Hubi does force so many third sets, is he likely to keep winning so many? That’s a more complicated question.

    What is a good three-set record?

    This is a great example of what’s missing from the tennis discourse. People talk about three-set records all the time, especially on broadcasts whenever two players head for a deciding set. We expect that top players win more one-set shootouts than journeymen do, but how many more? For a fringe top-tenner like Hurkacz, is 62.5% good? Great? Boringly in line with expectations?

    What makes this tricky is that, anecdotally, there are so many different types of three-setters. Last year, Hurkacz went three with four different players ranked outside the top 100. We’d expect him to win those; it’s a bit disappointing he didn’t win them even more quickly. Hubi also went to three deciders against a number one: two with Carlos Alcaraz, one with Novak Djokovic. We wouldn’t expect him to win those (and he didn’t), but simply taking a set is a moral victory. Any list of 32 three-setters is going to include a bunch of matches that should never have gotten that far. There might be 32 different levels of expectations, if we want to break it down that far.

    We don’t need to make it that complicated. What I want is a shorthand way of looking at a player’s three-set record and knowing whether he’s likely to keep it up.

    It turns out that you get pretty close with a simple formula. Tour regulars–defined here as players with at least 50 ATP main-draw matches in a season–tend to win between 50% and 60% of their third-set deciders. (On average, they clean up against lower-ranked players with less time on tour, as you’d probably expect.) We can estimate what a player’s three-set record “should” be as follows:

    Three-set win% = 45% + (20% * Two-set win%)

    That’s it. A player’s winning percentage in straight-set matches is a decent approximation of their current level: While it’s possible to luck into a two-set victory, it’s unusual. Here’s what the model implies as likely three-set records at various skill levels:

    Two-set W%  Three-set W%  
    40%                52.9%  
    50%                54.9%  
    60%                56.9%  
    70%                58.8%
    80%                60.8%

    Three-set records are rarely so extreme as two-set records. Djokovic, for instance, went 20-2 (!) in two-setters last year. The model predicts that he would win 63% of his three-setters. In reality he went 11-4 (73%), outperforming the estimate but still coming in much closer to 50%, as logic would suggest. Three-setters tend to occur between more closely-matched players, and once the outcome comes down to a single set, luck plays a larger part. Deciding sets aren’t as coin-flippy as tiebreaks, but as Hurkacz’s 14 third-set shootouts remind us, the margins can be equally slim.

    So, back to Hubi. Last year, he won 70% of his two-setters. A typical performance for a player like that would be a three-set winning percentage of 58.8%–a 19-13 record in deciders instead of his actual 20-12. Odd as his 2023 season was, he won the close ones about as often as he should have. Even if luck turns against him, he could finagle another top-ten finish with a stronger performance at the majors–but that’s a subject for another day.

    * * *

    Torben Ulrich (1928-2023)

    Torben Ulrich in 1957

    In 1955, Torben Ulrich invited a couple of visiting South African tennis players, Gordon Forbes and Abe Segal, to come see his band at a jazz club in Copenhagen. Ulrich, manning the clarinet chair, sat out the first several numbers. Forbes wanted to see his friend in action and encouraged him to join in.

    “I must wait,” Ulrich said, “until something happens inside me. So far nothing very much has happened.”

    The red-headed, bearded Dane died last month at the age of 95. In his near-century on earth, a whole lot happened. Yet he always operated on his own timetable. He once walked off the court when an opponent wouldn’t stop lobbing. (“I had asked him nicely several times to stop it, but he told me to mind my own business.”) Gene Scott told another story:

    There was this recent time in Richmond. There was this girl who was wearing a very short miniskirt. The whole house, including the players, could not keep their eyes off of her. Now, Torben is getting ready to serve when he suddenly freezes in midair, then walks over to the stands. Everybody is wondering where he’s going. He stops behind the girl and quickly drops a ball down her back. I know of no other player who has ever coped with a distraction in such a gentle, colorful way.

    Forbes recalled a club member who was impatient for Ulrich to vacate a practice court:

    ‘Have you been playing long?’ [the member] said.

    ‘As long as I can remember,’ said Torben.

    ‘How much longer will you play?’ asked the member.

    ‘We may go on for many years,’ said Torben.

    Ulrich did, indeed, go on for many years. He won his first tournament, the Danish Nationals, in 1948, when he was 19 years old. Three years later he picked up his first international singles title in Antwerp. He remained capable of top-level tennis for another two decades after that.

    “Over the years, it seems he has never lost the key,” a fellow player told Sports Illustrated in 1969, when Torben was 40 years old. “When it looks like he is ready to come apart, he comes up with that one big match. He remains respectable.”

    Ulrich was never a top-tenner; he failed to reach the quarter-finals of a major in 43 tries. Yet he piled up dozens of smaller tournament victories in singles, doubles, and mixed. He contested over 100 Davis Cup rubbers for Denmark, many of them alongside his younger brother, Jørgen.

    The Dane was perhaps more at home in the world of art. At various times, he wrote poetry and music criticism, painted, and made films. This side of him had a greater influence on his legacy. His son, Lars, was a promising junior tennis player, but he was probably made the right decision when he shifted his focus to music and co-founded the band Metallica.

    Torben, it seemed, was as happy with one pursuit as any other. He was a seeker–it didn’t much matter what. Tennis, with its whirlwind schedule and ever-changing mix of fellow-travelers, fit the bill.

    He didn’t care about results. Once, he told Forbes that he didn’t win. “I simply played in the usual way,” he said. “It was my opponent who lost.”

    Perhaps Ulrich’s career-best result came at the 1968 US Open, where he upset 15th seed Marty Riessen before falling to John Newcombe in a fourth-round nailbiter, 5-7, 4-6, 6-4, 10-8, 6-4. Newk’s serve could overpower a much younger man, but it was no match for Torben’s mind. “What is speed?” he mused. “If I am concentrating properly, really seeing, a big serve will be coming at me in slow motion.”

    The match could have gone either way. At a crucial moment, Ulrich flubbed an easy volley when a butterfly darted in front of his face. Was he distracted? He silenced the press with a question of his own: “Was I then a man dreaming I was a butterfly, or am I now a butterfly dreaming I am a man?”

    * * *

    What is this?

    After the Tennis 128 in 2022 and 1973 Redux last year, my plan is to return to contemporary tennis, with the usual hefty dose of analytics.

    My goal is to write as much as possible about the game between the white lines, as opposed to forecasts, ratings, previews, business, and–heaven forbid–tennis personalities and politics.

    I will also continue to look back to events from 50 years ago–and 100, and perhaps the occasional non-round number. 1974 was every bit as fascinating a season as 1973. I won’t do 100-plus installments, as I did last year, but I’ll revisit various pivotal moments as their anniversaries roll around, especially to commemorate the birth of World Team Tennis this summer.

    You can expect to find a new post a couple of times a week, probably more often during the majors. Your suggestions for topics are always welcome. Comments are open (provisionally! I cannot emphasize enough how provisionally!), and I’ll add a “suggestion box” to the sidebar one of these days.

    If you want to keep up with everything I’m doing here, please subscribe. Links to new article will also appear on the Tennis Abstract home page. I can’t promise I’ll always post links on Twitter.

    Happy new year!

    * * *

    Subscribe to the blog to receive each new post by email: