What Does Felix Auger-Aliassime Do So Right On Indoor Hard Courts?

Felix Auger-Aliassime has earned a reputation as a world-beater on indoor hard courts. He’s no Jannik Sinner–as Sinner reminded him all four times they met last year, twice indoors–but FAA is a fearsome customer against just about anybody else.

Last week the Canadian added to his indoor title haul with his second-straight championship in Montpellier. This time, he straight-setted Adrian Mannarino. While that win doesn’t particularly raise any eyebrows, the body of work keeps growing. It’s his eighth career title indoors, three of them at ATP 500s. Last fall in Paris, he also reached his second Masters final. (The first was in Madrid, the indoorsiest of the clay Masters.)

What’s the secret?

The conventional wisdom is that he has a big game, especially a deadly first serve. The controlled environment indoors, plus typically fast conditions, play to his strengths. The serves skid across the court even faster. His weaknesses are mitigated because the bounce is more predictable and because points are shorter.

All that sounds plausible. My only gripe is, couldn’t you say that about a lot of players? The whole paragraph applies, almost word for word, to Hubert Hurkacz, who has two Masters crowns on outdoor hard, plus a clay title, yet just a pair of indoor 250-level championships. What about Matteo Berrettini? The description might match him even better, yet the Italian has never won a title indoors. He has reached only one indoor 250-level final.

Before we go to the numbers, let me give you my seat-of-the-pants theory. FAA has huge weapons, but he doesn’t always play like it. He doesn’t consistently swat away easy plus-ones like Berrettini does. He gets sucked into long rallies, where he’s often at the disadvantage. Indoors, though, he knows what the tactics are, and he plays the way he should play. Indoor Felix, then, is the best Felix, both because his game is suited to the conditions and because he shows up with the right approach.

On the other hand, the last two points against Mannarino on Sunday were 8- and 18-shot rallies, respectively. So, you know, don’t trust my pants.

Numbers!

You can, however, trust the spreadsheets. The Match Charting Project has well over 100 Auger-Aliassime matches. Going back to 2020, the total includes 41 on indoor hard and 40 on outdoor hard, nicely suited for some comparisons. I was tempted to throw out the seven Tour Finals matches from the indoor tallies, because they skew the quality of the opponents, but the Canadian’s indoor averages are about the same with or without them.

Start with serve stats:

Surface       Unret%  <=3 W%  RiP W%  
Indoor Hard    35.7%   47.7%   55.5%  
Outdoor Hard   32.8%   43.4%   49.7%

About three percentage points more serves don't come back, and there's an even wider gap in points polished off on the serve or plus-one (the "<=3 W%" stat). The biggest gap here is in points won when the return comes back. Sub-50% is below average, especially for hard courts. 55% or better is very good, even in fast conditions.

Almost all of the indoor/outdoor serve differences are thanks to the first serve. FAA's second-serve numbers are about the same regardless of roof status.

Of course, Felix isn't the only guy on tour who wins more easy serve points indoors. I don't have comprehensive stats on the indoor/outdoor split, so I can't tell you the exact tour average. But we can compare how much Auger-Aliassime gains on serve to how much he gives up on return:

Surface        RiP%  RiP W%  
Indoor Hard   65.3%   48.8%  
Outdoor Hard  67.5%   43.2% 

He retrieves 2.2 percentage points fewer serves indoors--better than the 2.9-percentage-point difference he gains on serve. But when he gets the serve back, he's actually better indoors than outdoors! He gains five percentage points in that department on serve, and he gains the same margin on return.

This might dovetail with the conventional wisdom. His monster serve really pays off indoors. And predictable conditions give him a bit of cover on return.

Whatever the reason, Auger-Aliassime's groundstrokes are way more effective indoors. My Potency metrics, FHP and BHP, combine winners, unforced errors, and shots that set up winners and errors. They give you one-number estimates of how valuable each shot is, and... wow:

Surface       RallyLen  FHP/100  BHP/100  
Indoor Hard        3.7     +8.5     +0.0  
Outdoor Hard       3.9     +3.2     -5.8

His indoor points are a little shorter, but I assume that is typical. I would've guessed that the difference was greater.

The Potency numbers (expressed here as rates per 100 shots), tell a more emphatic story. A +3.2 FHP/100 is ok, not great. Tommy Paul and Ugo Humbert are in that zone. On the other hand, +8.5 is the 52-week average of Carlos Alcaraz. A -5.8 BHP/100 is near the bottom of the pack, below the likes of Ben Shelton and Grigor Dimitrov. By contrast, +0.0 is, as it sounds, a good solid average.

These numbers don't drill into the "why" questions that naturally follow. But they help us pick between theories. I suspect that much of the difference in groundstroke stats has to do with the shots he gets to hit. The winners are downstream of good serves. Auger-Aliassime picks up some aces, but he picks up more plus-one (or even plus-two) winners, and those make his forehand and backhand numbers look good.

The "indoor predictability" thesis also looks good here. Remember that everybody should benefit from that--and not everybody's numbers improve like Felix's do--but it may be that the Canadian is more-than-typically exposed by the vagaries of outdoor play.

All the angles

Quick thought experiment. Picture Roger Federer hitting an ace.

Now imagine Auger-Aliassime hitting an ace.

What specific serves came to mind? If you're like me, you pictured Federer shooting a bullet right down the tee. And then you visualized FAA hitting a flat bomb out wide.

Of course, both guys hit plenty of aces in every direction. The charting stats suggest that Felix has a slightly better chance of an ace when he goes up the middle. (Federer did too, by a bigger margin, as do most players.) Still, this indoor/outdoor split caught my eye:

Surface       Deuce Wide%  Ad Wide%  BP Wide%  
Indoor Hard         50.5%     47.8%     33.7%  
Outdoor Hard        46.9%     45.2%     41.0%

Each column shows how often Auger-Aliassime opted for a wide serve in various scenarios. The first-serve differences are probably more marked, because his second-serve tendencies are about the same.

Indoor, he goes wide more often--but less often under the pressure of break point. While the margins are rather slim, it seems like the wide serve becomes his bread-and-butter indoors, and he uses the tee serve to mix things up on break point--because he's hitting more wide serves the rest of the time.

Wide serves are more likely to come back, but they don't make the returner any more likely to win the point. Especially against Felix: His signature serve might not even be an ace, but a wide bomb that the returner just barely plops back over the net.

The fact that he hits more wide serves indoors explains a lot. He gets a few more unreturned serves (as everybody does, probably), but he gains more of an advantage on the serves that (weakly, oh so weakly) come back. His groundstroke stats sparkle, padded by those easy balls.

Here's one final comparison:

Surface       2ndAgg  
Indoor Hard       +7  
Outdoor Hard     +46

"2ndAgg" is the Aggression Score stat tailored specifically to second serves. A higher score means more double faults and more unreturned second serves. Lower means fewer risks on second balls. +7 is quite conservative: Only about a dozen players consistently score so low.

But--those careful second servers include Sinner, Hurkacz, and Berrettini. With a game like Auger-Aliassime's, the second serve isn't the time to take risks. And indeed, in all of his indoor finals, he has never topped a double-fault rate of 5%. In the Montpellier final, he missed his second serve just once, and he committed no double faults at all in the quarter- and semi-finals.

Here, finally, is some support of my seat-of-the-pants theory, that when Felix goes indoors, he plays the way he ought to be playing all the time. He stays within himself, which is still imposing enough to earn a lot of cheap points. It's not a particularly complicated story, and I'm still not convinced why it doesn't apply to a half-dozen other guys on tour. Maybe it is all about the wide serve, the signature shot that allows Auger-Aliassime to manage risk and put his opponents on the back foot, all at the same time.
Defanging the Ball Bashers With Sara Bejlek

On Saturday, 20-year Sara Bejlek won her biggest title–by far. She had just slipped out of the top 100, so after qualifying for the main draw in Abu Dhabi, she charged past the likes of Jelena Ostapenko and Clara Tauson, then secured the trophy with a 7-6, 6-1 win over almost-top-tenner Ekaterina Alexandrova.

It’s tough to overstate just how out of the blue this was for the Czech. By ranking, Ostapenko, Tauson, and Alexandrova represent three of her four highest-ranked victories. Her two other main-draw victims, Sonay Kartal and Ashlyn Krueger, also count among her top ten. And she beat Kartal 6-0, 6-2.

That’s a big-hitting set of opponents. Bejlek, by contrast, lacks the power weapons that are becoming standard on the WTA tour. As a left-hander, she practically begs us to call her “crafty.” One upset against that group is plausible enough: After all, Ostapenko’s low-percentage tennis invites chalk-defying outcomes. But so many?

The final

I don’t pretend to be an expert on the Czech’s game. She has only a couple dozen tour-level matches under her belt, so she’s a newcomer for most of us. That said, we now have a detailed match chart from Saturday’s final that offers some clues as to how Bejlek battled the barrage of ball-bashers in Bahrain Abu Dhabi.

The conditions helped. It was windy, and the conditions were slow. None of that favored Alexandrova, who likes predictable balls she can smack flat back across the net. The court speed not only made it difficult for Alexandrova to hit through the court, it gave her a little less pace to work with on Bejlek’s own balls. Surely the Russian must have wished she had played indoors in Ostrava(!!!) instead.

The lefty’s game plan seized on those advantages. She looped balls back down the middle. She sliced more than she had to, refusing to give her opponent a predictable bounce height. She mixed in some almost impossibly slow serves. She won the first point of the match with a dropshot-lob combo that, while she didn’t attempt many more, surely gave Alexandrova pause.

The central result was that the Russian just couldn’t hit winners. By my count, she ended with 13 winners against 37 unforced errors. Just as telling as the abysmal ratio was that the 13 winners represented less than 10% of total points. In her last 60 charted matches–going back to 2022–opponents have held her under 10% just six times. When they do, it’s usually because they take the racket out of her hands by playing hyper-aggressively themselves. Two of the opponents in question were Anisimova and Yastremska.

Bejlek, by contrast, gave Alexandrova ball after ball that looked like it should have been obliterated. In different conditions, or when the Russian was in better form, maybe the winner count would have been much higher. But from the first few games, it was clear that the Russian wasn’t confident in her ability to take control. Big, aggressive hitters usually have more influence on rally length than more passive opponents, but that wasn’t what happened on Saturday. The average point lasted 5.1 strokes, tied for third-longest among the nearly 100 charts we have from Alexandrova’s career.

Translated into tennis cliché: Bejlek let her opponent beat herself.

If we can extract one concrete skill from the Abu Dhabi final, it’s that Bejlek doesn’t let servers overpower her. 85% of Alexandrova’s serves came back, compared to a 52-week average of 75%. Again, we don’t have much data yet on Bejlek, but here’s another bit of evidence: In Madrid two years ago, she retrieved more than 80% of Rybakina’s serves. The Aussie Open champ is the toughest on tour to return, usually holding opponents to around 67%.

Despite all the frustrations and all the extra shots she had to hit, Alexandrova nearly pulled out the first-set tiebreak. She led 4-2 at the change of ends before getting dragged into a series of long rallies broken up only by a couple of well-executed short points from the Czech. Having dropped the 95-point slog that was the first frame, Alexandrova ran out of ideas. She simply watched the error count soar.

You don’t win slams by letting opponents beat themselves–marathon runners notwithstanding. But in the hands of someone persistent enough, it’s a game plan that can keep you in Bejlek’s new neighborhood of the top 40. With 500 points on the books from Abu Dhabi, the left-hander has the rest of the season to prove that she belongs.

The Rybakina Serves That Tipped the Scale In the Melbourne Final

In Saturday’s Australian Open final, Elena Rybakina won 92 points. Aryna Sabalenka won 92 points. Rybakina won 76% of her first serve points; Sabalenka won 75%. Both players held on to 48% of their seconds. Even their average first serve speeds were nearly identical, Rybakina’s 178 km/h nipping Sabalenka’s 177 km/h.

Only a few moments really mattered. Sabalenka converted two of eight break points. Rybakina converted three of six.

With such narrow margins, we should be cautious to draw conclusions about tactics and player skills. Flip one or two of those break opportunities, and it would have been a very different trophy ceremony. Anybody who tries to tell you “why” Rybakina won should keep that in mind. Still, Sabalenka would surely like to know how to secure another half-dozen points and put the result out of the range of luck. Rybakina will hope to do the same.

Pick target, hit target

Rybakina is the best server in the women’s game. Her ace rate over the last year is better than 10%–a percentage point ahead of second place (Osaka), and miles ahead of Sabalenka’s 6%. Rybakina has won nearly 75% of her first-serve points, while no one else cracks 73% and only a few players are on the north side of 70%.

At key moments on Saturday, Rybakina dazzled with her ad-court serves out wide. She saved the only two break points she faced in the first set with back-to-back unreturned serves, both wide. She finished the match with another signature delivery, acing Sabalenka out wide on match point.

If you’re looking for a “why,” it’s tempting to focus on those wide ad-court serves. Rybakina made 18 first serves when she aimed for that corner, and she won 14 of those points.

But! It’s not the ad-wide corner, specifically. Rybakina was even deadlier when she targeted Sabalenka’s backhand corner in the deuce court. She landed 14 of those first serves, winning 13.

Here’s the Rybakina method for defeating the world number one:

  1. Have a world-class serve
  2. Aim first serves at the backhand corner
  3. Make half of them

Easy, right?

Apparently not easy

Fair enough, most players don’t have anything like Rybakina’s serve. A few–Osaka, Noskova, Qinwen–can do a decent impression on a good day. Still, it’s an uphill battle to knock off Sabalenka with aggression from the line.

What’s striking, though, is that most opponents don’t really try.

Across 120+ charted matches since the beginning of 2024, Sabalenka’s opponents aimed their first serve at her backhand corner about 40% of the time. (That doesn’t mean they aimed 60% at the forehand corner: A fair number of first serves don’t land close to either corner.) In the vast majority of matches, her opponent aimed half or fewer of their first serves at her backhand corner.

On Saturday, Rybakina targeted the backhand corner 63% of the time.

The first serves that landed in were so devastating in part because she took a low-margin approach. Rybakina already misses more first serves than almost anyone on tour: Her 57.4% first-serve-in rate is worse than 45 of the top 50 women. Against Sabalenka, she succeeded exactly half the time when she fired in that direction. Corner-aimed serves are (unsurprisingly) lower-percentage for everybody, but her 50% was even worse than tour average.

It’s a smart tradeoff. Combine the two numbers, and we see that on 32% of her service points, Rybakina put a first serve in play to Sabalenka’s backhand corner. Those, as we’ve seen, are as close to guaranteed points won as you can find. Sure, that leaves 68% of service points to worry about. Yet as much as Rybakina’s premier weapon glitters, she’s a solid average at everything else. She’ll pick up a lot of those other points with quality second serves or rocket-powered firsts to the forehand corner, or by winning baseline rallies.

In the past two years, only a handful of players have managed to put first serves to Sabalenka’s backhand corner on as many as 32% of points. Even then, it doesn’t always work: Marketa Vondrousova, for instance, is unparalleled at hitting her targets, but her deliveries are softballs in comparison. For the players who can serve big, though, Rybakina may have pointed the way to tougher challenges against the world number one.

Ka-zam

This might be a recent refinement to Rybakina’s match tactics. We have over 80 charted matches for her since the beginning of 2024, and she has rarely aimed so many of her serves at the backhand corner. To be clear, she doesn’t need to. She straight-setted Sabalenka for the year-end title in November with only 44% of first serves pointed at that target.

But suggestively, Rybakina hit nearly as many first serves to the backhand corner in her Australian Open quarter-final match against Iga Swiatek. While she wasn’t quite as successful, landing just 40% of those attempts, the end result was encouraging. Even with all the misses, backhand-corner firsts accounted for a quarter of her service points. And she was as eye-poppingly successful on those points against Iga as she was in the final. Swiatek salvaged just 1 of 12.

It remains to be seen whether this is repeatable. When Rybakina is serving at her best, peppering the backhand corner is probably a good way to take advantage. (Unsurprisingly, since this is something tennis coaches tell twelve-year-olds.) If she’s misfiring, low-percentage first serves are probably not the way to fight her way through.

And surely, the world number one will start taking a few more backhand-return reps. She doesn’t have to turn into Andre Agassi to negate Rybakina’s new-found advantage. She just needs to defend that corner a little better. 94 or 95 points would have gotten the job done on Saturday. Even against a world-class serve and superb tactical execution, Sabalenka won 92. The two women will continue jostling for an edge, and it looks like the battle will increasingly take place with Sabalenka leaning to her left.

Surface Speed Convergence, One More Time

I wrote last week about the decline of specialization on the men’s tour. I proposed that we see more good all-around players because, as the overall level improves, there’s less relative value in being a one-dimensional servebot or dirtball grinder.

A few people responded–and I paraphrase, slightly: It’s the surfaces, stupid.

Everybody seems to agree that at some point, let’s say between peak Sampras and peak Djokovic, surface speeds converged. Hard courts got slower, and some grass courts got slower, too. Serve-and-volleying mostly disappeared, and grinding baseline play took over.

The only debate, it seems, is why. Was it a conspiracy to give the fans (well, all the fans except for the ones complaining) what they wanted? Is it the balls? The rackets? The strings?

I’ve always been skeptical of the conspiracy theory. More generally, I have been–and still am–skeptical that playing conditions have changed that much. Just because everybody believes something–even if those people are top-ranked players and well-respected pundits–doesn’t make it true. The historical record shows that styles have changed, but it’s much harder to marshal evidence that the surfaces themselves are meaningfully different than they were 20 or 30 years ago.

A quick review

I’ve looked at this stuff before. Here’s a quick summary:

  • The Mirage of Surface Speed Convergence (2013): I compared ace rates and break rates on hard and clay courts for pairs of players, 1991-2012. I found that the difference between hard courts and clay courts had, if anything, slightly widened, even though the conventional wisdom of convergence was fully in place by then.
  • The Grass is Slowing: Another Look at Surface Speed Convergence (2016): I wish I had named this differently, because I didn’t show that the grass slowed, I showed that rally lengths at Wimbledon (and to some extent at the hard-court slams) were converging with those at Roland Garros. It was my first stab at the problem using Match Charting Project data, which meant it used rally length, instead of ace and break rates. However, it relied on limited data, which meant there were heavy biases in which players it measured.
  • Surface Speed Convergence Revisited (2023): With more MCP data, I worked out a simple model of how much surface affected rally length, and how the effect had changed over time. Now without the selection bias, I showed that in both men’s and women’s tennis, the influence of surface on rally length had shrunk.

Pick your stat

To grossly oversimplify: If you look at ace rate, there’s no evidence of surface convergence. If you look at rally length, there is.

I didn’t want to rely on a 2013 mini-study for the ace-rate conclusion, so I came up with some new fodder.

My surface-speed ratings are based entirely on ace rate. Originally, this is because we don’t have better stats going very far back, while we do have ace rate for all ATP matches since 1991. The MCP has an increasing amount of coverage, but it is not complete, and the ace-based ratings have always seemed to capture surface-speed differences pretty well. There’s some noise, because there are only so many matches per tournament per year. But in general, they give us a pretty good idea of what’s going on.

The downside is that they are indexed to each year’s average. The rating for the 1991 edition of Wimbledon is 1.20, meaning that–controlling for the mix of players–there were 20% more aces than a 1991-average event. This year, Wimbledon’s rating was 1.12: 12% more aces than the 2025 average. But are those averages the same?

That question offers us a neat little experiment. Instead of indexing on a single-year average, why not do two years at a time? The pool of players was almost identical in 1992 as in 1991, so it’s a fair comparison. As it turns out, Wimbledon’s ace-based surface rating went down from 1.20 to 1.06 between 1991 and 1992. That kind of shift often happens due to randomness, but maybe it could be validated by a longer trend. Looking at two years at a time–1991 and 1992 together, 1992 and 1993 together, up to 2024 and 2025 together–allows us to make the same comparisons for the entire tour calendar, for a span of 35 years.

Well, in that span, ace rate has gone up quite a bit. And not just because mediocre servers have been replaced by better ones. On average, the same servers (against the same returners, though the returner effect is much smaller) have upped their ace rate about 2% every year. Not enough to notice as it happens, but enough to move the ATP tour average ace rate from below 7% in 1991 to a bit over 10% today. Some of the difference is due to the tournament mix–a shorter clay calendar, mostly. But I ran the same analysis on a core group of 15 events that have been in the same place since 1991, and the controlled-for-players increase is still 1.6% per year.

What about convergence, taken literally? Have faster events gotten slower, while slower events have sped up?

Nope! The variance between tournament ratings is almost exactly the same in 2024-25 as it was in 1991-92. An example: Back then, Wimbledon’s two-year average was 1.13, while Monte Carlo was 0.58. Over the last two years, Wimbledon’s rating has been 1.14, with Monte Carlo at 0.57.

It’s the strings

How do we reconcile the evidence that ace rate has gone steadily up, while rally length has also increased?

Setting aside laboratory-type measurements (like CPI/CPR, which we don’t have far enough back, anyway), the purest way to measure court speed is ace rate. A slow court keeps the ball on the ground longer and slows down the rest of its trajectory. Returning is all about reaction time, and ace rate tells us whether returners physically got there or not. That’s why there are, reliably, so many more aces on hard and grass courts than on clay, and on faster hard courts than slower hard courts.

Now, it could be that players have gotten stronger, serve tactics have gotten less predictable, and racket/string technology allows servers to put the ball in the corner more often. All of that is probably true, so the 2%-per-year average likely overstates the change in surface. The ace increase might entirely be attributable to training and tech. But if you want to argue that surfaces have gotten slower, you’ve got an uphill battle to explain how aces have gone so far in the wrong direction.

The rally-length trend is easier to explain. Unlike ace rate, shots-per-point isn’t just about how the ball interacts with the surface. It’s about tactics and spin.

And actually, tactics are themselves largely about spin. And spin, well, that brings us to polyester strings.

Modern topspin is possible largely thanks to polyester strings. The best-known milestone is Gustavo Kuerten’s 1997 French Open title, the first major won with a Luxilon-strung racket. It took a few years for everybody to make the switch, but polyester string was kryptonite for serve-and-volleying. Now it was possible to hit returns that dipped to the server’s feet at the net. All that topspin also made it tougher to move forward. More topspin meant that deep groundstrokes were higher-percentage shots, and that opponents needed to give up even more ground to comfortably handle them.

When I wrote about Lleyton Hewitt a few years ago, I showed how Hewitt forced Roger Federer to basically give up serve-and-volleying. That was 2002-05. If it hadn’t been Hewitt, it would’ve been someone else–or everybody else.

Less serve-and-volleying, safer groundstrokes, fewer net approaches overall … all that adds up to longer rallies. No surface change necessary.

… and the youth

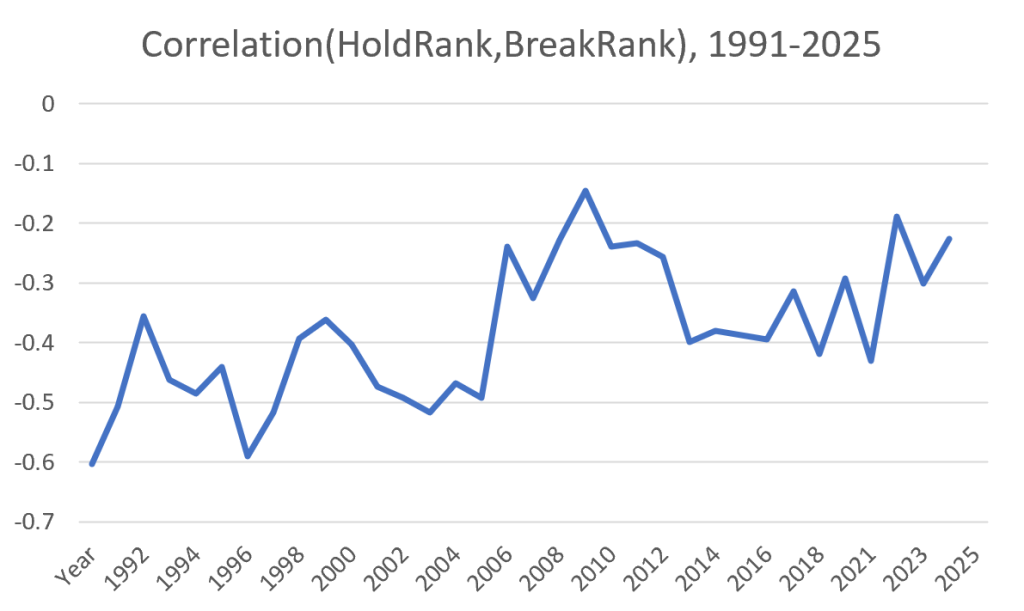
Let me show you the graph from my decline-of-specialization piece again. Generally speaking, it shows how much serve skill is related to return skill. Higher numbers (closer to zero) indicate a closer relationship, or in tennis terms: more all-around players.

Someone on Twitter reasonably asked, what’s up with the peak around 2008-2010? It’s a noisy graph, but a plausible interpretation is that it breaks down into two segments. Up to 2005, most of the data points are between -0.4 and -0.5, with a couple on either side. Since then, the line rarely dips below -0.3. (2013-16 leaves some explaining to do.) Accept this reading, and 2008-10 isn’t a stand-alone peak, it’s the solidification of a new era.

What else was going on in 2008-10? Novak Djokovic won his first slam, and Rafael Nadal established himself as an all-court force. In short, this is when people really started talking about surface speed convergence. Probably not a coincidence.

But why then? Well, in the spring of 1997, the tennis world figured out that polyester strings weren’t just the misguided side-hustle of a bra-strap company. Players with an eye on the future started to switch.

When Guga lifted his trophy, Nadal was 11 years old. Djokovic was 10.

The learning curve

Professional tennis is tough. Players like their gear. They’re used to their gear. It took years for Federer to give up his 90-square-inch frame. Sampras never did abandon his 85-square-incher. When a pro finally does switch, the benefits are hardly instantaneous. It might even mean a temporary step back.

The ultimate advantages go to the tech-natives. For all of Kuerten’s success with Luxilon, he was never going to wring the full benefit of the new technology and the tactics that it implied. If a certain racket/string setup is optimal, the players who do the most with it will be those who built their entire games around it. I don’t know whether the critical age is 8, 11, or 14 (maybe it helped Federer that he was a bit of a late bloomer), but it definitely isn’t 20 or 25.

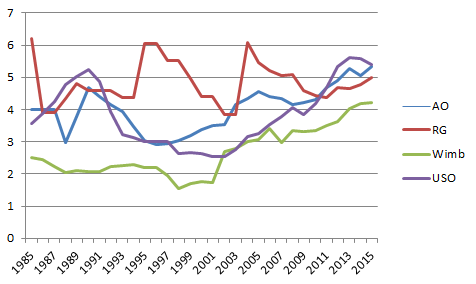
Check out the rally-length graph (based on slam finals) from my 2016 piece:

Wimbledon went from a low in 1998-2001 to a completely different level by 2006-08. Not a coincidence. The slam-finals graph tells the story of a select few guys, but by the late 2000’s, a whole generation of polyester natives–Djokovic, Nadal, Murray, Nalbandian, Berdych, Ferrer, Monfils–had taken over.

None of this requires the surfaces to change one iota. Maybe fans or tournament directors wanted longer rallies, maybe they didn’t. They were going to get baseline tennis no matter what.

Playing styles converged because topspin-powered strategy works across surfaces in a way that no previous style did. Rallies got longer because the players who tried to shorten them were stranded in the forecourt. They fumbled half-volleys into the net or watched passing shots as they whizzed by. Surfaces ended up as the scapegoat for a new era, but they didn’t cause it.

Why Can’t Iga Swiatek Beat Jelena Ostapenko?

Jelena Ostapenko in Stuttgart

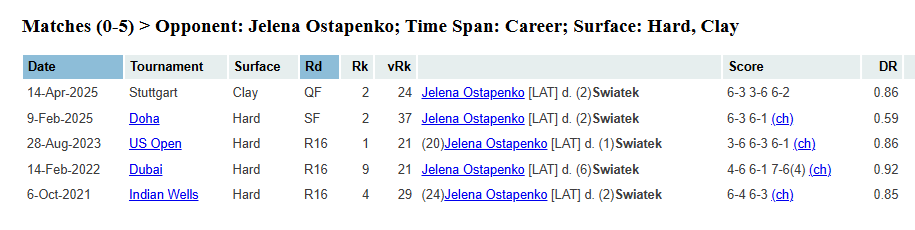
Jelena Ostapenko is now 6-0 against Iga Swiatek. Their first meeting doesn’t really count: It was on grass, and Iga was 18. Since then:

One was close, and Swiatek picked up a set in two others. These are (usually) not blowouts. But most of the time Iga faces an opponent outside the top 20, it is a blowout–in the other direction.

Ostapenko is a special case. No one on tour is more aggressive. Her make-or-break style, standing inside the baseline and swinging for winners even on service returns, turns every match into something more like a coin flip. If her aim is off, she can lose to anyone. By the same token, she’s the worst opponent for a top seed to draw in the middle rounds:

Career, Ostapenko has 25 top-ten wins, 21 of them when she was outside the top ten herself. It’s an exaggeration to say that her opponent doesn’t matter, but opponent matters less to the Latvian than to probably anyone else on tour.

Keep it simple

It’s tempting to go straight to the mental explanation: Ostapenko has gotten into Iga’s head, etc. That might explain why the head-to-head is 6-0 instead of 4-2 or 5-1. But there is a more concrete basis for the fact that the underdog keeps coming out ahead.

One of Swiatek’s lesser-known assets is her ability to win serve points. While she doesn’t have the best serve on tour, her opening delivery is quite fast, she rarely misses, and it sets up the rest of her game to finish off points. Over the last 52 weeks, she has held 79% of her service games, more than any other WTA player: Yes, even Aryna Sabalenka.

In their last five meetings, Ostapenko has broken her 31 times.

Against everybody else, Iga gets her share of service winners, and when the ball comes back, her unparalleled baseline skills keep the odds in her favor. Though she can rally with the best of them, she keeps points relatively short. Her serve points average 3.8 strokes, compared to tour average of 4.2.

Against Ostapenko on Saturday, her average serve point lasted 2.8 shots.

Another way to see the Penko effect is to look at the horrible things she does to Swiatek’s top-line serve numbers:

Matches   1stIn  1st W%  2nd W%  
Last 52   64.9%   68.3%   50.3%  
vs Penko  57.8%   51.8%   45.7% 

Among the WTA top 50, Iga ranks in the top dozen for all three of those stats. The Latvian turns her into a wholly ineffectual version of herself. (In my earlier piece about Ostapenko, I wrote that she turns the rest of the tour into Madison Brengle. Even Iga!)

52% of first-serve points won is atrocious. No top-50 player stands below 57%. Sara Sorribes Tormo is the only woman who can compare. 46% isn’t quite so dire: Elise Mertens typically plays at that level, to take one example. But it’s a marked decline from Swiatek’s usual standard.

If you want to make case that Ostapenko has gotten into Iga’s head, the first-serve-in rate is one place to start. There is some tactical basis for taking more first-serve risks against a free swinger. But in this case, they don’t seem to pay off at all. That dreadful 52% win rate on first serve points is the result of hitting them bigger! Iga took more chances on second serves as well. She is typically one of the stingiest women on tour when it comes to double faults, but she piled up eight of them on Saturday.

The clay conundrum

I intended to write a version of this piece back in February, when Ostapenko trounced Swiatek in Doha. Though I missed my chance, I intended to make clear that Iga couldn’t beat her nemesis on hard courts.

And here we are, two months later. Ostapenko leads the clay-court head-to-head, 1-0.

Sort of. Stuttgart’s conditions are hardly those of Rome or Roland Garros. The tournament is held indoors, and the surface doesn’t behave like the crushed brick in Paris. Big servers have traditionally done better in Stuttgart than elsewhere on European clay. Ashleigh Barty won the title in 2021, and both Linsday Davenport and Maria Sharapova three-peated. Iga is a two-time champ as well, but not because the surface is particularly favorable.

Ostapenko scored her latest “upset,” then, on a relatively fast dirt court, one of that doesn’t give Swiatek’s topspin the big bounce it gets on traditional clay. A lower bounce lets the Latvian step in and swing away, much like she does on hard.

On the other hand, Penko is far from hopeless on the slow dirt. She beat Simona Halep to win the 2017 French Open! Worse, from Iga’s perspective, surface speed doesn’t seem to hinder her game style. Here are the rally lengths from the last few “slow clay” Ostapenko performances logged by the Match Charting Project:

Match               Result           RallyLen  
2024 Rome           L vs Sabalenka        2.6  
2023 Roland Garros  L vs Stearns          2.7  
2023 Roland Garros  W vs Martincova       3.4  
2023 Rome           L vs Rybakina         2.9

It’s not the most instructive sample–Ostapenko vs Sabalenka is going to come out under three shots per point on a court made of glue–but it’s clear that the Latvian doesn’t morph into Chris Evert when the conditions change.

At a certain level of aggression, surface just doesn’t matter that much. While Ostapenko doesn’t have an elite serve, she successfully targets the corners, opening up space for easy (for her) winners on the next shot. She takes such breathtaking risks that opponents sometimes are still leaning the wrong way as her shot finds a corner. Slow clay gives players an extra split second to react and respond. A split second is not enough to negate the Ostapenko barrage.

What to do?

Swiatek is one of the best players in the world–indeed, she already ranks among the all-time greats. It can’t really be hopeless.

There are basically two options: Stop Ostapenko from playing her game, or play Ostapenko’s game, but better.

In Stuttgart, Iga seemed to attempt the second. As we’ve seen, she took more chances on both first and second serves, though that tactic didn’t work out. She hit service returns harder, aiming for lines rather than relying on her topspin to give her a Nadal-esque margin of safety on groundstrokes.

At times, it worked. Swiatek hit nearly as many winners as Ostapenko in the second set. When the Latvian lost her way a bit, Iga barely let her win a second-serve point, picking up nearly three out of four. Penko broke her six times, but Swiatek got four of them back.

The play-like-Penko approach should ultimately stop the bleeding. This was the third time the women reached a deciding set; one of these times, the Latvian’s risk-taking will fail to pay off. Nearly everyone else on tour has picked up a win or two against Ostapenko: If Yulia Putintseva can do it, certainly Swiatek can as well.

Iga, though, would prefer something more than just continuing to flip the coin. Is there a way to consistently beat someone with such an outrageously dictatorial game style?

I’d love to give you a galaxy-brain answer here, but I don’t have one. (Wim Fissette hasn’t helped Iga find one either, so I certainly don’t have much of a chance.) At times on Saturday, Swiatek seemed to be trying to wear down the Ostapenko backhand. It is the Latvian’s weaker side, but it is still the source of numerous, often improbable winners. Riskier serving came up empty. The topspin is worthless, though it may have its place in more favorable conditions.

No one on tour owns Ostapenko the way she owns Iga. (Edit: Except Victoria Azarenka–thanks to several of you for pointing that out.) No style or set of tactics–except Vika’s, so far–stops her every time. Sabalenka had won all three meetings with the Latvian, then she managed just five games in yesterday’s Stuttgart final. Sabalenka is one of the few women who can out-hit anybody, but even that level of power isn’t enough to shut out Ostapenko.

The only player reliably able to defeat Penko is herself, and even she hasn’t managed it with Iga standing across the net. She may have another chance in just a few days: The two women are lined up to face each other in the Madrid fourth round. Ostapenko is a mere 5-7 at the event in her career, but she is surely salivating at the chance for another shot at her favorite victim.

* * *

Subscribe to the blog to receive each new post by email:


Are Second Serves Mostly Useless?

Novak Djokovic loading up for some topspin

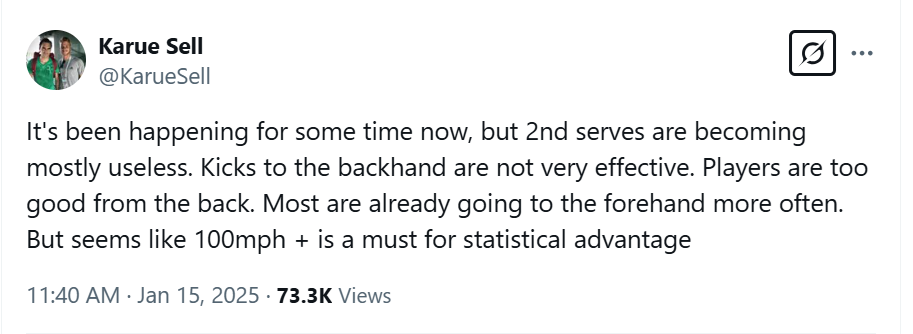
During the Australian Open, Challenger player (and Youtube star) Karue Sell made a bold statement:

Thank you, Karue, for posting this: It is always valuable to get specific claims about the game from the people who are trying to figure out how to win. Right or wrong, testable propositions like these help nudge our understanding in the right direction.

Now: Right or wrong?

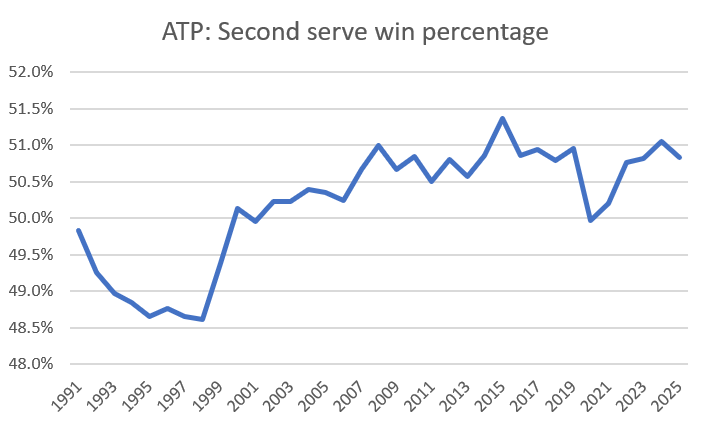
Are second serves becoming mostly useless? A first look at the data says no–or, at least, they aren’t becoming any more useless than they were before. Here is second serve win percentage for tour-level matches since 1991:

The important thing here isn’t the trend. It’s the narrowness of the values. The difference between the lowest and highest ticks on this graph is only three percentage points, and half of that happened before the century turned. Strength and strategy may be different–we’ll get to that–but the results aren’t. If anything, second serves have become (modestly) less useless.

This trend holds up even when we tweak the parameters. Yes, the surface mix of the tour has changed since the 1990s. But if we look only at hard-court matches, there’s an even tighter range of yearly averages, between 48.9% and 51.2%. At Sell’s Challenger level, I only have data back to 2010. In that span, hard-court second-serve win rates have drifted less than a single percentage point, between 49.7% and 50.6%.

I can’t help but notice that Sell’s own Challenger-level second-serve win percentage is a healthy 52%. I’m sure it sometimes feels useless: The last match he played before making the comment was a qualifying-round loss in which he salvaged less than 40% of second-serve points. But despite his relatively small stature, he won more main draw second-serve points last year than Matteo Berrettini did–albeit against weaker competition.

Risk and reward

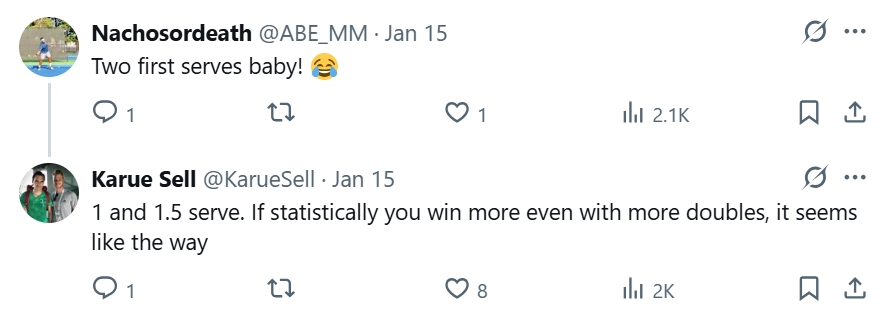
No one wants to settle for historical average. Inevitably, someone brought up the notion of two first serves:

No, two first serves are not the way. But Sell recognizes what might work. At least in theory, players should take more risk on second serves (and perhaps on firsts, as well), hitting bigger and winning more points at the cost of more doubles.

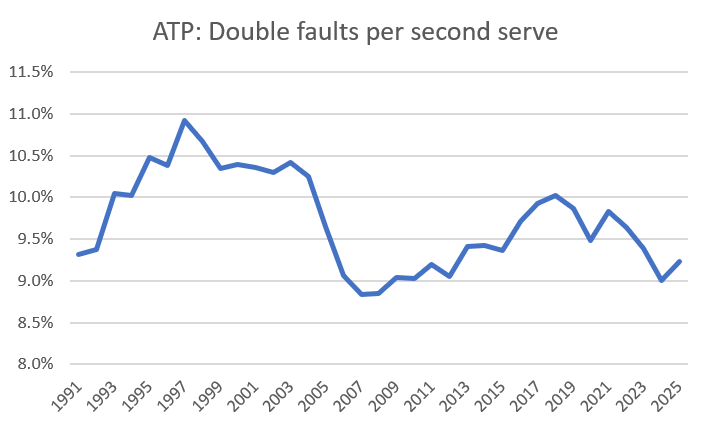
If tennis trends proceeded by opinion poll, I think we’d already see evidence of this. I certainly never see anyone argue that players should be more conservative with the second ball, unless they’re talking about a particular struggling player. But all that matters is what happens on court, and there’s no sign there of more double faults:

Again, the framing doesn’t matter. The numbers are about the same regardless of surface, and Challenger players have moved in the same direction. In fact, the 2025 Challenger rate so far is 9.8%, the first time that the minor leaguers have dipped below double digits.

To be clear, I wouldn’t expect any sudden moves here. A generation of players grows up learning certain serves and tactics, and there’s only so much they can do to change them. An equation might spit out that someone would win, say, 56% of second-serve points in exchange for accepting a 12% double-fault rate. But do athletes really have such fine-grained control of the risks they take? I suspect not, which means another generation may go by before we see a true “1 and 1.5” strategy.

Is 100 miles per hour a must?

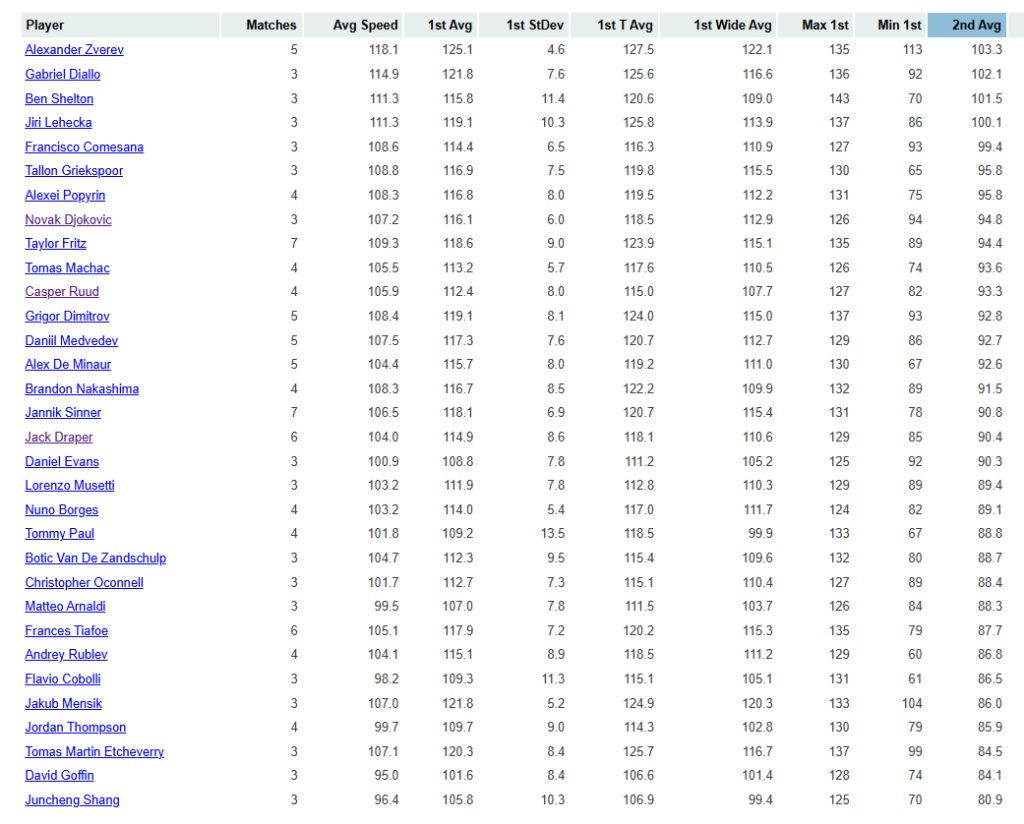
How fast do second serves need to be? While I can’t imagine any player would turn down a triple-digit average, we’re nowhere near that level. The rightmost column shows the average second-serve speeds at the 2024 US Open for every player who reached the third round:

Only 4 of 32 averaged triple digits. Just five posted a mark at or above 96 miles per hour. The dominant tournament winner, Jannik Sinner, barely topped 90.

It’s possible that the sensors (or the balls, or the humid conditions, or pick your variable) resulted in low readings: US Open speeds are typically several miles per hour lower than Wimbledon speeds, even for the same players. But the gap isn’t enough to push more than a quarter of these guys over the magic number.

Still, Sell could be correct on the trend, if not on the detail. Maybe second serves are getting faster, or slower second serves are more likely to end in a point lost.

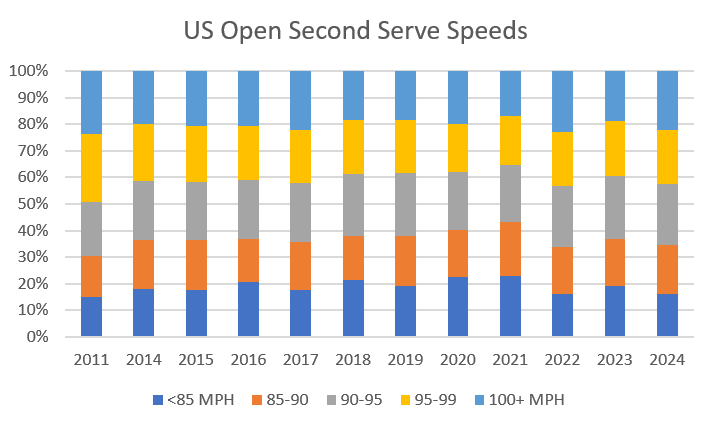
US Open data, though, suggests that second serves have stayed about the same. I have relevant data back to 2014, plus 2011. Splitting second serves into buckets of 100-plus miles per hour, 95-99, 90-94, and so on, it’s tough to find much of a trend:

(In case you’re wondering, the 2012-13 data has serve speeds, but no indication of first or second serves. Not very helpful here!)

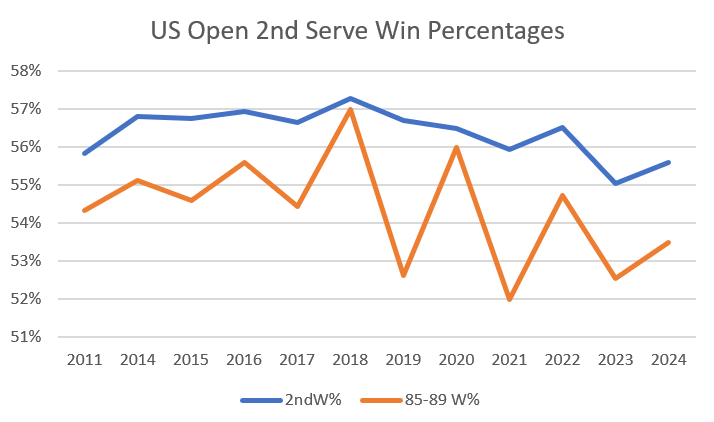
Same story with win rates. As with the tour in general, the US Open has seen a steady percentage of second-serve points won. The next graph shows year-by-year win rates both overall and for the 85-89 mile-per-hour bucket, on the theory that if returners were feasting on relatively weak seconds, it would show up there:

While the 85-89 mph results are noisy, there’s not much to see here. The overall win rate in 2024 is almost identical to what it was 13 years earlier. There’s a bit of space between 85-89 mph second serves in 2011 and 2024, but still not much.

It’s certainly true that harder is better, and that hasn’t changed. At every one of these US Opens, the win rate of 100-plusses exceeded the win rate of sub-85s by at least five percentage points, and the gap rose as high as ten points at the 2020 Covid event. But we’ve yet to find much evidence for the notion that second serve speeds or results are any different than they were 10, 13, or even 30 years ago.

Are servers going to the forehand more often?

Finally, we can say… maybe?

I pulled all hard court matches since 2014 between right-handers from the Match Charting Project database. (Hard court, because it’s so much easier to run around second serves on clay; 2014, because that’s when the project started, so there’s not as much bias toward big-name players and matches; right-handers, because lefties, while fascinating, make things way more complicated.)

The charts classify serves into three categories: Wide, body, and T. Second serves to the “body” usually aren’t good: Those are serves that didn’t find a corner. In the men’s game, that’s 35-40% of seconds. It’s tough to tell from the chart–and sometimes even when watching a match–exactly which side the server targeted, because it is so easy for the returner to take a step or two around it and hit a forehand.

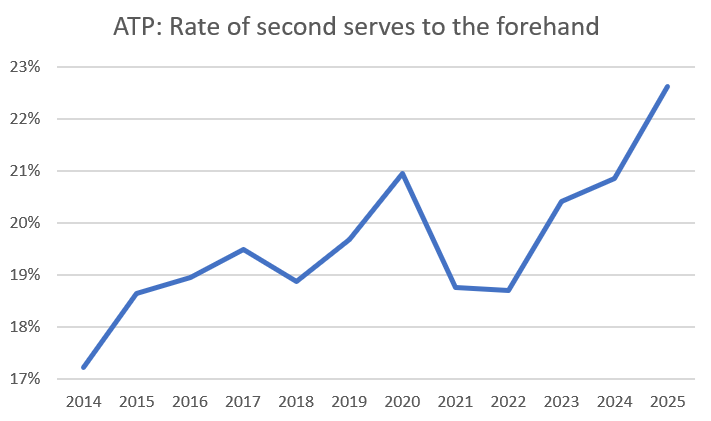
Servers are indeed more likely these days to find the forehand corner:

This isn’t an enormous move, but it seems like a real thing. If we throw out the 2020 Covid season, it would look like an even more dramatic shift just in the last few years.

However, more second serves to the forehand corner does not mean fewer second serves to the backhand corner. These extra forehand-targeted serves are coming at the expense of the mediocre “body” seconds. Servers drill the backhand corner 30% to 35% of the time, and that range hasn’t budged over the last decade.

I’d more inclined to say, then, that players have gotten a bit better. And they’ve chosen to use that improvement to keep returners off balance, aiming a few more second serves to the forehand side.

Are players too good from the back?

Sell’s theory is that more second serves are targeting the forehand, because the backhand is no longer such a weak side. We can use the same subset of MCP data to check how (right-handed) returners have fared against second serves to their backhand corner:

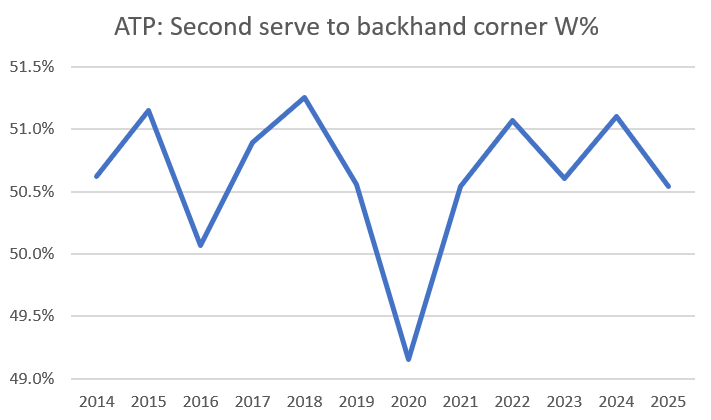
Again, 2020 is weird; other than that, we’re just looking at noise. (Or, possibly, the signature of a drunk blue M&M.) The long-term average of this stat is 50.6%, and in ten of the twelve seasons, the single-year number was within half a percentage point of that.

Backhand returns may have gotten stronger, but if so, serves are advancing at the same rate.

What gives?

Why would Karue identify trends that, for the most part, have so little evidence to support them?

First, the tour is getting stronger, at backhand returns and everything else. Some serves that would’ve gone unreturned in 2005 or 2015 are coming back today. As we’ve seen, servers are maintaining a balance. But it’s easy to suffer a few bad results and conclude that drastic changes have taken place.

Second, Karue himself played his best tennis last year. He cracked the top 300 for the first time and played a dozen Challenger main draws. That meant he faced stronger competition than ever. The Challenger tour is full of baseline battlers with sturdy backhands; there isn’t a huge gap between the return skill that Sell faces these days and the elite-level returning we watch on TV. Moving up from ITFs to Challengers means that some weapons don’t work anymore, and–especially for smaller guys–new tactics are needed.

I’d love to see Sell, or anyone else, give a serious trial to the “1 and 1.5” serve strategy. Hit seconds harder, attack the forehand more often, and accept more double faults. Karue might be right about what the future of second serves will look like, but we’re not there yet.

* * *

Subscribe to the blog to receive each new post by email:


Jasmine Paolini’s High-Wire Act

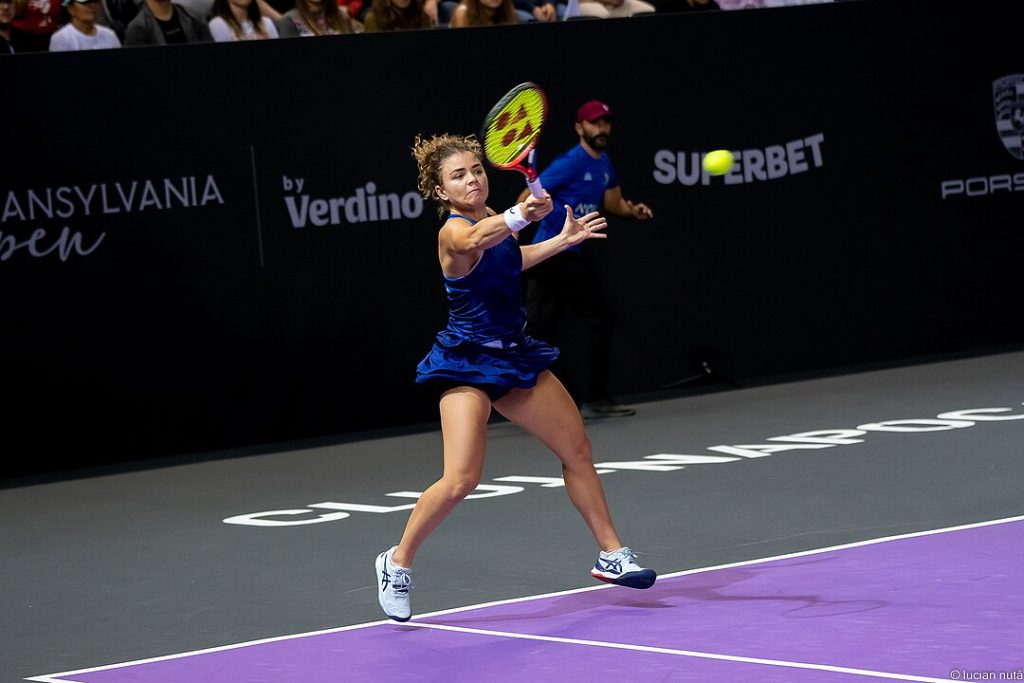
Jasmine Paolini at the 2022 Transylvania Open. Credit: Nuta Lucian

There are unorthodox aging curves, and then there’s whatever the hell Jasmine Paolini is doing right now. The best women tennis players tend to make their presence known in their late teens. I wrote earlier this year about the “improbable rise” of 22-year-old Emma Navarro.

Paolini is 28.

When Paolini was the age that Coco Gauff is now, she was ranked just inside the top 300, fresh off a first-round loss at an ITF $25K in Bulgaria. When she was the age that Iga Swiatek is now, she had finally cracked the top 150, about to head to Wimbledon qualifying. (She lost in the first round there, too.) When she was the age that Aryna Sabalenka is now, she had just stumbled through a four-match losing streak to the likes of Jil Teichmann and Irina-Camelia Begu that knocked her out of the top 50.

Just 16 months ago, Paolini was once again outside the top 50. For a five-foot, four-inch counterpuncher with no obvious weapons, she had achieved a great deal. There was little reason, though, to think she could climb much higher. Her peers were getting bigger, the game was becoming ever more aggressive, and she was reaching the age at which WTA stars begin to think about what else life might hold for them.

Then she started winning.

Since leaving Wimbledon last year, the Italian has won 66 of 99 matches, including two major semi-finals and five top-ten scalps. She picked up her first 1000-level title and made four other finals. Yesterday, she led Team Italy to a Billie Jean King Cup crown, starring in both singles and doubles en route to the championship. Her ranking is up to an astonishing 4th in the world. As if that weren’t enough, she’s in the top ten in doubles.

None of this was supposed to happen. Paolini’s late-2023 surge to the top 30 was one thing; what has happened since simply defies belief. How has she managed it? Is it a fluke, or will we see the Italian at the 2025 year-end championships as well?

Opportunistic effects

First, a bit of a caveat. Paolini, like Taylor Fritz, has played the official ranking system like a Stradivarius. She reached only three finals in 2024, yet two of them were slams. The other was a 1000. She earned huge chunks of points for a semi-final defeat of Mirra Andreeva at Roland Garros, a semi-final squeaker against Donna Vekic at Wimbledon, and a Dubai title that didn’t require her to face a top-ten opponent.

None of this is meant to take away from Paolini’s accomplishment. She beat the players in front of her, and in the case of Andreeva, she did so in emphatic fashion. The point is that her top-four finish has more to do with good timing than consistently dominant play.

My Elo ratings offer a second opinion, using an algorithm based on the quality of her opponents, rather than the venue and round of each match. By Elo, she stands in 9th place, just ahead of Madison Keys and Diana Shnaider, well back of Jessica Pegula and Elena Rybakina. Still a very good season, if a bit less astounding.

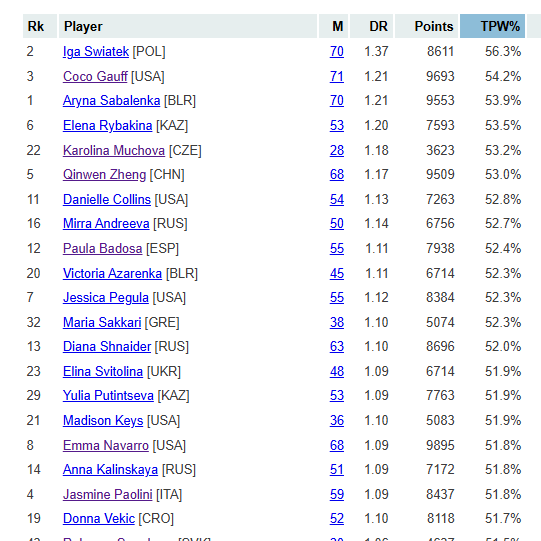
Even more revisionist is the total-points-won leaderboard. Going into the BJK Cup Finals, Paolini had won 51.8% of her total points this season. That’s a respectable rate, especially for someone who hovered in the 50% range for most of her tour-level career. But it is not typically top-five, or even top-ten material:

By this metric, the Italian stands in 19th place among the WTA top 50, behind a handful of players who didn’t even crack the official top 20. That doesn’t really mean she’s the 19th best player on tour: She faced one of the toughest schedules of anyone. Much as I love both Yulia Putintseva and counterintuitive arguments, I’m not going to try to convince you that Putintseva had the better season.

Still, Paolini’s position on the TPW list tells us something about how she won her matches. She didn’t lose many blowouts, but she didn’t win many, either. (She certainly didn’t get in the habit of spanking opponents like Swiatek and Sabalenka do.) Ten of her wins required a third set. Two victories–including the Wimbledon semi-final–came despite losing more points than she won.

The margins were not so narrow that we can ascribe the Italian’s breakout to luck. (Though the Vekic match could have gone either way, to say the least.) But this is the high-wire act that took Paolini to the top. She doesn’t have the tools to bludgeon her opponents. She has done a lot of things right to win 42 matches this year. To keep winning at a two-of-three clip, she’ll need to continue executing the new game plan to near-perfection.

The new game plan

It’s a bit tricky to isolate the key changes in Paolini’s approach, because–like Qinwen Zheng–she’s doing almost everything better than she did before the surge. That said, a few things stand out.

Check out the Italian’s breakdown of points won by rally length (in Match Charting Project-logged matches) before this season, compared with her performance this year:

Span     1-3 W%  4-6 W%  7-9 W%  10+ W%  
2016-23   49.1%   46.5%   51.0%   49.4%  
2024      49.8%   54.3%   56.6%   49.1% 

Paolini’s improvement in 7- to 9-stroke rallies is significant, and her gain in the 4- to 6-shot category is enormous. In very short points and very long ones, little has changed.

Especially in the categories of shorter points, we need to keep in mind what these win rates measure. It’s tempting to think of a prototypical short point, then imagine Paolini, instead of her opponent, winning it. But the length of a given point is not handed down to us by God. When someone like Paolini starts winning more shorter points, it’s because she is ending them before they become long points, and/or she is preventing her opponents from ending points quickly.

The Italian can hardly stack up one-shot points (unreturned serves), and she can’t even reliably put away plus-ones–though she is doing that more than she used to. Instead, like the expert doubles player she has become, she can structure points that inch closer and closer to a point-ending opportunity. Call it plus-two tennis, aggressive point construction for undersized counterpunchers.

The plus-two forehand

Tactics are one thing; Paolini is a top-ten player because she has executed them so well. Her forehand is a big reason why.

She is ending points with her forehand at a much better clip than she did before the calendar flipped to 2024, and her inside-out forehand has seen particular improvement:

Span     FH Wnr%  DTL Wnr%  IO Wnr%  FHP/100  
2016-23    11.7%     17.7%     6.2%      2.9  
2024       17.5%     25.2%    13.3%     10.2

Here, “winners” refer to both clean winners and shots that induce forced errors. Through 2023, Paolini’s forehand winner/forced error rate of less than 12% put her in the bottom quarter of tour regulars. 17.5% moves her to the top third, not far behind Swiatek and Keys. The same stat for inside-out forehands (IO Wnr%) doesn’t put her in quite the same company, but it is an even better reflection of the tactical shift. Before, the Italian rarely used that shot as an offensive weapon; now it is a regular part of the arsenal.

The bottom line is reflected in the Forehand Potency (FHP/100) numbers. The number of points Paolini earns with her forehand more than tripled from previous seasons to 2024. That doesn’t quite account for the entire shift from a top-50 player to a top-fiver, but it explains a whole lot.

And the no-fearhand

One side effect of the Italian’s forehand-centered strategy is that she is less afraid of other players’ forehands.

Again, Paolini is doing just about everything better. For instance, 22% of her first serves went unreturned in 2024, compared with 20% in the past. Nice little boost, but not something you would notice by watching a couple of matches. A bigger shift is where she puts the first serves:

Span     1st Unret%  <=3 W%  RiP W%  D Wide%  A Wide%  
2016-23       20.2%   28.1%   48.3%    25.0%    45.7%  
2024          21.8%   34.8%   53.4%    37.4%    44.8%

Check out the rate at which she is hitting deuce-court first serves wide (D Wide%). 25% to 37% is a massive change, and one that would be dangerous for a different sort of player. In the deuce court, the down-the-tee serve is the conservative one: It goes to the backhand of a right-handed returner, and since it lands in the middle of the court, the returner doesn't have any sharp angles to exploit. The wide serve is the opposite, feeding forehands to opponents like Sabalenka, Rybakina, or Zheng along with the angles necessary to turn them into winners.

What Paolini knows--again, like a savvy doubles player--is that most players will fail to convert the majority of those opportunities, even if they occasionally smack a highlight-reel return winner. The Italian didn't crack the top five by running the table against the elite. Most of her 42 wins came against the next rung of competitors, women who are often held back by inconsistency. Paolini pushed them off the court, giving the choice of either going big (and frequently missing), or sending back a shot that she could handle with her own (improved!) forehand.

All those deuce-court wide serves explain how Paolini picked up so many more plus-one winners (the <=3 W% column) and converted so many in-play returns overall (RiP W%). Every individual wide serve is a gamble, but the Italian has discovered that, on net, they pay off.

The way forward

I'm a bit surprised to find myself concluding that, yes, Paolini might just maintain this level. The odds are heavily against another top-five finish. That was a quirk of her draws and well-timed (probably accidental!) peaks. But 52% of total points? A single-digit year-end ranking? Maybe!

Once I began thinking of the Italian's singles play in terms of doubles strategy, it all clicked. Her anticipation is outstanding--and like everything else, it is better than it was last year. She often wins points without working particularly hard. She's in the right place to end the point on the fifth or sixth shot of the rally. (That place is increasingly at the net. She came to net more in 2024, and she won more of those points than before, too.) Anticipation isn't a skill that will deteriorate with age, nor is it one that opponents can neutralize.

Paolini's new point-shortening, forehand-smacking, deuce-court-serving tactics aren't going to earn her many big upsets, just as they haven't so far. The strongest players--not coincidentally, often the ones with the most fearsome forehands--are the ones in the best position to take advantage the wide deuce-court serves and force the Italian both to move off the baseline and rely more on the backhand.

But a top-ten season doesn't require a pile of top-ten victories. Paolini was 3-6 against that group this year, and that included one win against a fading Ons Jabeur and another in Riyadh against a rusty Rybakina. The Italian's finish owed much more to her 38-15 record against everyone else. Despite the improbability of a top-ten debut at age 28, Paolini has built a game capable of repeating the feat in 2025.

* *

Subscribe to the blog to receive each new post by email:


The Newly Opportunistic Taylor Fritz

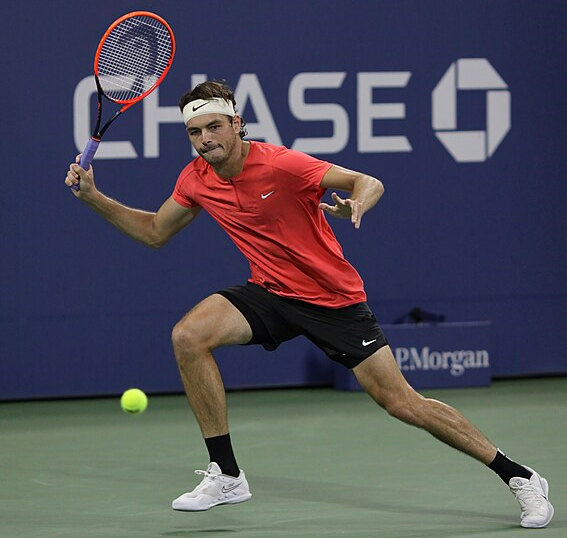
Taylor Fritz at the 2023 US Open. Credit: Andy M. Wang

Taylor Fritz has been remarkably consistent over the last three seasons. He ended the 2022 campaign ranked 9th, finished last year 10th, and enters this week’s Tour Finals in 5th place, with a chance to overtake Daniil Medvedev for a spot in the top four.

Take a look at his top-line statistics for 2022, 2023, and 2024. They’re sorted by total points won (TPW). Can you tell which one belongs to his career-best current season?

Year   Win%   1st%   2nd%    RPW    TPW  
???   68.8%  78.4%  54.3%  37.7%  53.0%  
???   70.4%  78.3%  55.8%  36.2%  52.8%  
???   69.1%  76.4%  52.6%  38.2%  52.4%

You might be tempted to go with the first row, since he won the most points then. But the margin is small, and he won matches at a better clip in the second. Wait, though: He snagged the most return points in the third season, and more breaks of serve are particularly crucial for a player hovering in the 36% to 38% range.

I won’t leave you hanging. The second line belongs to 2024. Here are the three stat lines, now sorted by season:

Year   Win%   1st%   2nd%    RPW    TPW  
2024  70.4%  78.3%  55.8%  36.2%  52.8%  
2023  68.8%  78.4%  54.3%  37.7%  53.0%  
2022  69.1%  76.4%  52.6%  38.2%  52.4% 

The 27-year-old American is clearly doing something right that isn’t captured by the usual stats. 10th to 5th is a major move. Last year he didn’t even qualify for the Tour Finals. After beating Medvedev yesterday, he’s one win away from a probable berth in the semis. What’s going on here?

All the right matches

The official ranking system ensures that tournaments and matches are very much unequal. When Fritz beat Frances Tiafoe in the Acapulco quarter-finals last year, he gained an additional 90 points for his semi-final showing. When he slipped past Tiafoe in this year’s US Open for a place in the championship match, he earned a whopping 480 points.

I could just about stop here. 480 points is the difference between Fritz’s current point total and 8th place. A slightly bigger difference of 560 points would knock him down to 10th, and he’d be hanging around Turin this week as an alternate. His stats would barely change, but the story of his season would be very different.

It’s not just the Tiafoe match; it’s more than the US Open final. 2024 was the first year that Fritz lived up to expectations at the slams in general. Here are his grand-slam win totals back to 2018:

Year  Wins                  
2024    17                  
2023     8                  
2022     8                  
2021     6                  
2020     6  * no Wimbledon  
2019     4                  
2018     4

No top tenner would be happy with just eight wins at majors. Simply reaching the fourth round at each slam adds up to 12. In 2022, Fritz lost five-setters to Stefanos Tsitsipas and Rafael Nadal, then fell to a streaking Brandon Holt in Flushing. Last year, he suffered two second-round exits. Both five-setters, the losses came against Alexei Popyrin in Australia and Mikael Ymer at Wimbledon.

When the 2024 season kicked off, Fritz had just two major quarter-finals to his name. His career record in five-setters was 8-10.

Since then, the American has reached three more quarters (including the US Open final run). He won four five-setters against just one defeat. He avenged the Melbourne loss to Tsitsipas and twice upset Alexander Zverev, a player who had beaten him in five of eight previous meetings.

The re-balancing

The odd thing about Fritz’s season is that his slam success has been offset by weaker results elsewhere. Returning to the observation I started with: He won nine more matches at majors in 2024 than in 2023, but his winning percentage barely budged. Instead of losing to Ymer or Holt on a big stage, he fell to Matteo Arnaldi in Acapulco, Thiago Seyboth Wild in Miami, Alex Michelsen in Geneva, and more.

It was a smart trade, though it was surely not a premeditated one. You can train with the majors in mind, but you can hardly punt an early-round match at a 250 with any kind of hope that it will result in a quarter-final victory at the next slam.

There’s another category, though, in which Fritz may have used stronger tactics to get better “luck.” Here are the American’s tiebreak records since 2021:

Year  TB W-L    TB%  
2024   21-11  65.6%  
2023   25-17  59.5%  
2022   24-20  54.5%  
2021   20-15  57.1%

The 2023 mark of 59% is about where Fritz should be, based on the rate at which he normally wins serve and return points, combined with the matches in which he finds himself in tiebreaks. 2024 was the first season he beat tiebreak expectations by a non-negligible margin.

This could be luck. Tiebreak records fluctuate, and very few players sustain records above or below expectations for long. Still, the American might have figured something out. In the sample of 2024 matches logged by the Match Charting Project (plus several others from grand slams), Fritz is serving way better in tiebreaks than he has in the past:

Year  TB SPW  
2024   80.3%  
2023   65.6%  
2022   70.9%  
2021   65.0% 

80% is Isner territory. In the improbable event that Fritz can sustain these kinds of numbers, coupled with a solid return-points-won rate around 38%, he should be winning even more tiebreaks than he already does.

I don’t want to overemphasize tiebreaks: After all, his 21-11 record is only one or two tiebreaks better than it “should” be. On the other hand, it’s easy to scan through Fritz’s career results–including those at majors–and see how one or two tiebreaks could change the story. He took a first-set tiebreak from Tsitsipas in Melbourne this year. He split two against Zverev at Wimbledon, then took two of two from the German in New York. Take one of those away–just one!–and again, he might be watching the Tour Finals from the sidelines.

Zverev tolerance

Regardless of whether tiebreak luck played a role, Fritz’s two major victories over Zverev helped to define his season. Neither pre-match betting odds nor my Elo ratings predicted an American victory on either occasion.

Both Fritz and Zverev are tall guys with big serves; either one can put away a service game with four quick strikes. One key difference between them is that Zverev is more patient, comfortable playing long points from the baseline. This isn’t necessarily an asset: It isn’t always in the German’s interest to let matches go that way. But if you’re going to pick one of these two guys to play points from the baseline, it’s pretty clearly Zverev.

In the US Open quarter-final, though, 39 points went ten strokes or longer. Fritz won 20 of them. In the fourth-set tiebreak, three and half hours into the battle, the American won two of two: a 24-stroke grinder that Fritz finished at the net, then a 12-shotter on match point that Zverev squandered with a unforced forehand error.

Two lessons jump out. First, the American can hold his own from the backcourt with one of the best baseliners in the game, at least on a hard court. Second, that skill doesn’t seem to fade with fatigue, something that might have caused Fritz’s five-set struggles in the past.

A third takeaway may be even more important. Instead of the numerator–20 points won–consider the denominator: 39 points played. The first time Fritz and Zverev met at a major, at Wimbledon back in 2018, barely half as many points lasted so long, even though the match itself was longer. Yes, the surface kept that number down, but not by a factor of two. At Washington early in Fritz’s career, on a surface more like that in Flushing, the two men played an entire match with just one rally that reached ten strokes.

In that 2018 Wimbledon meeting, Fritz held his own in the long rallies, winning 9 of 21. The problem was his rush to avoid them. He committed 56 unforced errors to the German’s 36.

Zverev keeps his unforced error rates down because he is willing to wait. He forces opponents to take risks unless they want to spend all day grinding out baseline battles. Most players in the Fritz mold–including Fritz himself, in the past–opt to take their chances. They usually lose, which is why Zverev is ranked second in the world. The American has steadily improved his groundstrokes and his fitness to the point that he doesn’t need to take low-percentage big swings. It’s no guarantee of victory–after all, Fritz won just 50.9% of points in the Flushing four-setter–but it’s a better bet than the alternative.

Let’s play ten

There’s a wider lesson here, and not just for Taylor Fritz. We tend to think of long-rally proficiency as a clear-cut skill. Yes, some players are better at it than others, but not by a wide margin.

Here are the long-rally (10+ shots) winning percentages for the ATP top ten, based on Match Charting Project data for the last 52 weeks:

Player            10+ W%  
Alex de Minaur     57.4%  
Carlos Alcaraz     57.1%  
Jannik Sinner      55.8%  
Daniil Medvedev    55.0%  
Grigor Dimitrov    54.2%  
Novak Djokovic     52.8%  
Andrey Rublev      51.8%  
Casper Ruud        50.2%  
Alexander Zverev   50.2%  
Taylor Fritz       46.8% 

Before I studied this, I would’ve expected considerably more dispersion. While every edge counts, this one is not as crucial as it gets credit for. Fewer than one in ten points reach the long-rally threshold, so even the most extreme gaps–like that between Fritz and de Minaur here–would determine the outcome of only the closest matches.

More important, I suspect, is willingness to play these points. Fritz is never going to crack the top half of a list like this. He has–to his credit–maxed out the rally tolerance that his size and physical gifts will grant him. Still, a 47% chance of winning a protracted point is better than his odds after belting a low-percentage salvo to avoid the battle altogether.

Players who serve as effectively as Fritz does tend to be considerably less sturdy from the baseline. Pros with his (adequate if not world-beating) groundstrokes are often less inclined to rely on them. One-dimensional big servers almost never reach the top five. Yet Fritz, combining his primary weapon with a tactical savvy that allows him to maximize the rest of his assets, has done exactly that.

* * *

Subscribe to the blog to receive each new post by email:


Aryna Sabalenka, Drop Shot Queen

Aryna Sabalenka, watching another poor woman hopelessly run around

In May this year, Aryna Sabalenka unleashed a new weapon: a drop shot she was willing to use far more than ever. After winning six of six drop-shot points in a Rome first-rounder against Katie Volynets, Sabalenka inflicted 28 droppers on Elina Svitolina. That match went to a third-set tiebreak, and her 15 outright drop-shot winners represented more than the margin of victory.

In her career up to that point, Sabalenka’s drop shots represented 1.1% of her (non-serve) strokes–about half the tour average of 2.2%. That rate nearly quadrupled, to 4.1%, for her eleven matches in Rome and Paris. On faster courts since, it has fallen, but not all the way back. Her drop-shot rate since June has been 1.9%. As we will see, the weapon has continued to give her more value even as she uses it less often.

The tactic makes perfect sense for a player with Sabalenka’s skills. She hits hard from the baseline, so opponents are usually positioned defensively, on the back foot. She’s capable in the forecourt (former doubles #1!), so not only does she have the touch to pull off the deception, she has the ability to deal with the rapid-fire net play that can ensue when someone runs a drop shot down.

The only question–had we thought to make the suggestion, say, a year ago–was whether the idea appealed to her. Not everyone is Carlos Alcaraz, ready to throw the tennis equivalent of a curveball into any point. Sabalenka was doing fine bashing groundstrokes into submission; why change? Now we know she’s comfortable with the tactic, even if 4% is probably reserved for the slowest courts.

How, then, does Aryna’s drop shot stack up against those of her peers, in terms of frequency, success rate, and value? I wrote two articles in March that outlined various ways of analyzing drop shot tactics. Those pieces looked at Alcaraz, Alexander Bublik, and the men’s game in general. The same approach can shed light on Sabalenka and the women’s tour, as well.

Getting the drop

All the data in this piece is based on the shot-by-shot logs from the Match Charting Project. I’ve limited the scope to the last decade. Nearly every tour-level Sabalenka match is charted, but for many other players, coverage is more limited. It’s also not necessarily random, so these numbers are approximate.

It’s also important to define “drop shot.” For the purposes of this piece, I’m looking only at the first drop shot in each point. “Re-drops” are a skill of their own, and probably a very different one. They are also tough to study because they are so much rarer than the already-uncommon standard drop shot. So we skip them for now.

Let’s start with the most prolific WTA drop-shotters since 2015. Remember that tour average is 2.2%–one dropper per 45 shots or so. Here are the thirteen women who have equaled or exceeded clay-Aryna’s 4.1% for their entire (charted) careers:

Player                Drop%  
Yulia Putintseva       8.6%  
Ons Jabeur             8.2%  
Laura Siegemund        7.6%  
Anastasija Sevastova   6.6%  
Marketa Vondrousova    6.3%  
Petra Martic           5.6%  
Kristina Mladenovic    5.2%  
Su Wei Hsieh           4.5%  
Agnieszka Radwanska    4.2%  
Karolina Muchova       4.2%  
Kiki Bertens           4.1%  
Viktorija Golubic      4.1%

Everything checks out so far. Putintseva dropshots to drive you nuts, Jabeur hits them to show off, and Aga did it just because she could.

The other end of the list has its amusements as well. In over 50 charted matches, spanning over 7,000 points, Camila Giorgi hit five drop shots. Yes, five. Two of them went for winners, and she lost the other three.

More important than frequency is points won. Here are the 14 women whose career drop-shot win rates surpass Sabalenka’s recent clip of 55.6%:

Player                 Drop%  Point W%  
Dominika Cibulkova      2.5%     61.4%  
Qinwen Zheng            2.0%     60.7%  
Sara Sorribes Tormo     2.3%     60.4%  
Ashleigh Barty          1.7%     59.5%  
Barbora Krejcikova      1.8%     59.0%  
Marketa Vondrousova     6.3%     58.7%  
Emma Raducanu           1.6%     58.3%  
Liudmila Samsonova      1.3%     58.2%  
Bianca Andreescu        3.2%     58.1%  
Anett Kontaveit         1.1%     57.4%  
Sofia Kenin             4.1%     57.4%  
Aliaksandra Sasnovich   3.3%     56.6%  
Sorana Cirstea          1.9%     56.3%  
Kiki Bertens            4.1%     56.1%  
…                                       
Average                 2.2%     52.6%  
…                                       
Aryna 2017-Apr '24      1.1%     53.2%  
Aryna 2024 Rome/RG      4.1%     61.9%  
Aryna 2024 2nd half     1.9%     55.6%

There is virtually no correlation between frequency and success rate, so players like Vondrousova and Kenin (and slow-clay Sabalenka) really stand out.

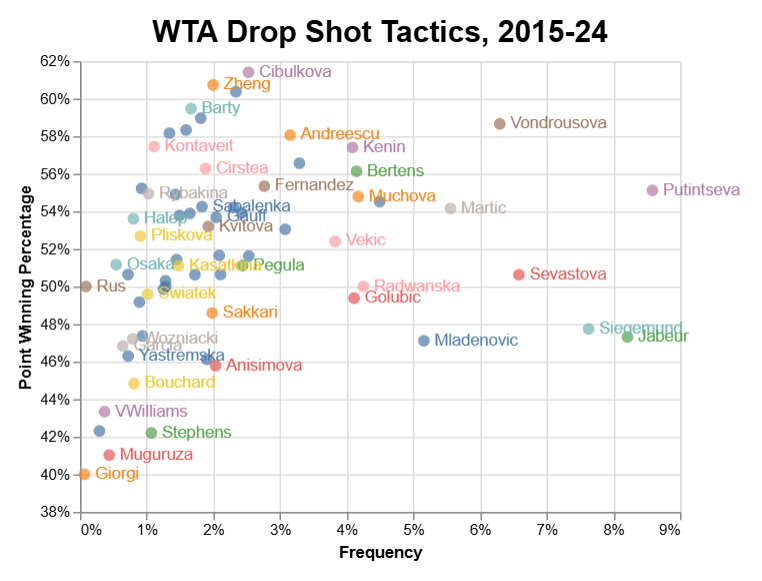
Here’s the same dataset, with more players, in visual form:

Most women cluster in the 1-2% frequency range, regardless of their drop-shot skills. Vondrousova and Putintseva really stand out for their combination of frequent attempts and consistent success.

Chasing down value

As much as youngsters dream of someday showing up on a leaderboard on this blog, what really matters is winning points. You can do that by hitting tons of drop shots and winning those points at a decent rate (like Putintseva), or by choosing moments carefully and executing well (like Qinwen Zheng).

Assume for the time being that the typical drop shot is hit from a perfectly neutral position, one in which each player has a 50% chance of winning the point. Combine the two metrics we’ve seen so far–multiply frequency by the difference between winning percentage and 50%–and we have the value added by a player’s drop shots. I’ve multiplied the results by 1,000 so all the zeroes don’t make our eyes hurt.

Player                 Drop%  Point W%  Drop Pts/1000  
Marketa Vondrousova     6.3%     58.7%            5.4  
(Aryna 2024 Rome/RG)    4.1%     61.9%            4.9  
Yulia Putintseva        8.6%     55.1%            4.4  
Sofia Kenin             4.1%     57.4%            3.0  
Dominika Cibulkova      2.5%     61.4%            2.9  
Kiki Bertens            4.1%     56.1%            2.5  
Bianca Andreescu        3.2%     58.1%            2.5  
Sara Sorribes Tormo     2.3%     60.4%            2.4  
Petra Martic            5.6%     54.2%            2.3  
Aliaksandra Sasnovich   3.3%     56.6%            2.2  
Qinwen Zheng            2.0%     60.7%            2.1  
Su Wei Hsieh            4.5%     54.5%            2.0  
Karolina Muchova        4.2%     54.8%            2.0  
...                                                   
(Aryna 2024 2nd half)   1.9%     55.6%            1.1  
Average                 2.2%     52.6%            0.6  
(Aryna 2017-Apr '24)    1.1%     53.2%            0.4  
...                                                    
Elise Mertens           1.9%     46.1%           -0.7  
Sloane Stephens         1.1%     42.2%           -0.8  
Amanda Anisimova        2.0%     45.8%           -0.9  
Kristina Mladenovic     5.2%     47.1%           -1.5  
Laura Siegemund         7.6%     47.7%           -1.7  
Ons Jabeur              8.2%     47.3%           -2.2

Clay may be particularly drop-shot friendly, but still, how about clay-Aryna!

At the other end of the spectrum… is Jabeur actually bad at drop shots? We need more context before we could establish any such conclusion. Perhaps the Tunisian hits droppers at particularly desperate times. Still, it’s jarring to see the star’s name at the bottom of the list.

Did someone say context?

The most common situation for a Sabalenka drop shot is when she makes a first serve and the ball comes back to her backhand. Over her entire career, when she hits a dropper with her second shot, she wins 51.1% of points. If she doesn’t go for the drop, she wins 51.8%.

Without camera-tracking data, that (and the dozen-plus analogous categories) is as far as we can drill down. Maybe the returns to the backhand that she dropshots are different from the ones she doesn’t. Match Charting Project data can’t tell us that.

Adjusting for context remains valuable even with those limitations. We can classify each drop shot by whether the player who hit it was the server or returner, whether it was a first or second serve point, whether it was a forehand or backhand-side drop shot, and how far into the rally it occurred. When Aryna waits one more shot on a first-serve point, her drop is much deadlier. Instead of the 47% of points she wins on a third shot from her backhand side with something other than a drop shot, she wins 55%.

The list looks quite a bit different when we take these additional factors into consideration. I tallied each player’s results in each of those categories, so we can compare their drop shot winning percentages with how they fared in the same mix of situations. “DSWOE” is Drop Shot Wins Over Expectation, the ratio between the two numbers:

Player               Drop W%  Exp W%  DSWOE  
Dominika Cibulkova     63.5%   50.1%   1.27  
Petra Martic           54.2%   42.9%   1.26  
Sara Sorribes Tormo    60.4%   47.9%   1.26  
Martina Trevisan       59.5%   48.7%   1.22  
Marketa Vondrousova    58.7%   48.1%   1.22  
Danka Kovinic          56.0%   46.1%   1.21  
Sorana Cirstea         56.8%   46.8%   1.21  
Kaja Juvan             58.5%   48.4%   1.21  
Ashleigh Barty         59.1%   49.3%   1.20  
Kiki Bertens           56.2%   47.2%   1.19
...  
Average                51.3%   49.2%   1.04
...  
Ons Jabeur             47.3%   47.8%   0.99  
Agnieszka Radwanska    48.9%   49.9%   0.98  
Maria Sakkari          48.6%   49.9%   0.97  
Jelena Ostapenko       49.7%   52.9%   0.94  
Caroline Wozniacki     50.0%   53.3%   0.94  
Elise Mertens          46.1%   50.2%   0.92  
Serena Williams        45.5%   49.8%   0.91  
Amanda Anisimova       45.8%   50.4%   0.91  
Sloane Stephens        44.1%   48.8%   0.90  
Iga Swiatek            49.6%   56.2%   0.88

(The winning percentages here are very slightly different from the ones above because some of the data wasn’t detailed enough to be used for this calculation.)

The average rate of 1.04 seems plausible. Players generally know what they’re doing; they wouldn’t hit drop shots if they didn’t have reason to think it would improve their odds. Jabeur does indeed look better in context. She still finds herself in the bottom ten, but a DSWOE of 0.99 means that if she is costing herself anything with all the droppers, it isn’t much. It’s possible that even this more granular approach is missing some details that would explain why Ons makes the decisions she does.

I must also acknowledge the oddity of finding Swiatek at the bottom of the list–or any list. Her 49.6% drop shot win rate isn’t that bad: It’s what she does the rest of the time that is such an outlier. She isn’t known for her drop shot, and she doesn’t hit many. So as with Jabeur, it’s possible that these categories don’t capture how hopeless the situations are when she tries to drag her opponent up to the net.

This metric confirms our story about Sabalenka. Her drop shots were fine–if rare–before May, became devilishly effective on the clay, then settled back to a more modest level on faster surfaces:

Player       Drop W%  Exp W%  DSWOE  
2017-April     53.3%   51.2%   1.04  
May            61.9%   51.4%   1.20  
Second Half    55.6%   52.4%   1.06

Buried in the details of Aryna’s respectable 1.06 ratio since June is a particularly encouraging trend. Remember those plus-one backhands that she shouldn’t have been dropshotting? Since June, she basically stopped. Out of 108 total drop shots, those have represented only five.

Drop and roll

For someone who hits as hard as Sabalenka does, throwing in a drop shot can be about more than just winning a point. Once an opponent realizes that they might have to chase down a dropper, they are that much less focused on defending against deep groundstrokes.

That’s the idea, anyway. When I wrote about drop shots in the men’s game, I was surprised to discover that drop shots didn’t influence the outcome of subsequent points in the way I expected. The majority of drop shots are hit by servers, but after they hit one, servers are less likely to win points later in the same game. If there is any discernable pattern in the ATP data, it is that once a drop shot is played–whichever player makes the move–the returner has an edge for the rest of the game. This probably isn’t a causal relationship: Perhaps drop shots are more likely to come into play when the server is struggling to control the action.

The data for women’s tennis tells a different story. On the point after a drop shot–win or lose!–the drop-shotting player wins 51.1% of the time. Two points later, there’s still an advantage, and the edge stays in place for the remainder of the game:

Situation          Win%  
Next point        51.1%  
Two points later  50.7%  
Same game         50.7%  
All others        49.9%

That advantage is not the same for every player. The following list shows the point winning percentages for players who get the biggest post-drop-shot bang for the buck, along with those who–like servers in the men’s game–see their post-drop fortunes dip.

Player                Same game  All others   Diff  
Jasmine Paolini           56.5%       50.4%   6.2%  
Marta Kostyuk             55.9%       50.1%   5.8%  
Sloane Stephens           55.0%       49.9%   5.1%  
Beatriz Haddad Maia       53.0%       48.7%   4.3%  
Qinwen Zheng              54.5%       50.7%   3.8%  
Naomi Osaka               54.5%       50.8%   3.7%  
Anastasija Sevastova      53.3%       49.7%   3.7%  
Maria Sakkari             53.1%       49.7%   3.3%  
Angelique Kerber          53.8%       50.5%   3.3%  
Su Wei Hsieh              50.9%       47.9%   3.1%  
Karolina Pliskova         54.0%       51.0%   3.1%  
Danielle Collins          53.7%       50.7%   2.9%  
Marketa Vondrousova       52.8%       50.0%   2.8%  
Agnieszka Radwanska       54.0%       51.4%   2.5%  
Garbine Muguruza          53.4%       50.9%   2.5%  
Aryna Sabalenka           55.0%       52.5%   2.5%  
…                                                   
Average                   50.7%       49.9%   0.7%  
…                                                   
Ons Jabeur                50.2%       50.3%   0.0%  
…                                                   
Emma Raducanu             49.6%       51.1%  -1.5%  
Ashleigh Barty            51.5%       53.0%  -1.5%  
Eugenie Bouchard          48.9%       50.6%  -1.7%  
Svetlana Kuznetsova       47.8%       49.8%  -2.0%  
Karolina Muchova          48.6%       50.7%  -2.1%  
Monica Niculescu          46.9%       49.1%  -2.2%  
Barbora Krejcikova        47.4%       50.1%  -2.7%  
Jessica Pegula            47.6%       50.6%  -2.9%  
Lesia Tsurenko            44.5%       47.5%  -3.0%  
Caroline Garcia           44.9%       49.6%  -4.7%

Jasmine Paolini! It’s tough to pinpoint exactly what she does that has caused her improvement in 2024. Her post-drop-shot success rate is too niche a skill to account for much of it, but it’s fascinating to consider.

I added Jabeur to this list because she illustrates one of the factors that makes analyzing drop shots so complicated. As noted, the theory is that once a player hits a drop, her opponent has to start thinking about it. But against Jabeur, opponents have to think about it from the moment they step on court! One more drop shot from the wizard isn’t going to change that.

That’s just one reason why the relationships between frequency, success rate, and post-drop-shot success rate are unpredictable. Some players, like Stephens and Osaka, play droppers rarely. They don’t win much when they do. But the after-effect might make up for it. At the other end, Muchova has a great drop shot that she deploys often, and for whatever reason, her results on subsequent points suffer.

Back to Sabalenka one last time. I snuck her into the table above because, even before she hit lots of drop shots, she saw a post-drop boost. You will not be surprised to learn that those numbers have gotten better in the last six months:

Span            Same game  All others  Diff  
2017 - Apr '24      54.3%       52.3%  1.9%  
2024 Rome/RG        60.2%       53.7%  6.5%  
2024 2nd half       58.9%       54.2%  4.8%

Clay-Sabalenka got the best of both worlds. She won more points by playing the drop, and she won more points because of the tactic’s lingering effect. Perhaps because of her growing reputation as a drop shot queen, the effect has persisted since June, even when she doesn’t go to the well so often.

The Aryna Sabalenka path to drop shot success won’t help everybody. But no matter how we slice up the numbers, it sure has worked for her.

* * *

Subscribe to the blog to receive each new post by email:


Does Mpetshi Perricard’s Backhand Even Matter?

Giovanni Mpetshi Perricard in Basel, playing a longer rally than usual.
Credit: Skyscraper2010

The story of last week’s tournament in Basel was the blistering service performance of Giovanni Mpetshi Perricard. The six-foot, eight-inch Frenchman racked up 109 aces in five matches, including more than one-third of his service points in Sunday’s final against Ben Shelton.

Mpetshi Perricard is a big server straight out of central casting. He can nail the corners at 150 miles per hour; on Sunday he hit one second serve at 146. He puts plenty of mustard on his groundstrokes as well. He often plays a high-risk brand of baseline tennis, recognizing that with a serve like his, he only needs to break once or twice–or just pick off a couple of return points in the tiebreak.

The Frenchman’s rapid rise through the ranks also fits his style. For a big server, wins can come in batches, when conditions–or, simply, tiebreak luck–are on his side. After an unexpected breakthrough on clay in Lyon, Mpetshi Perricard upset Sebastian Korda (in four tiebreaks!) and reached the second week at Wimbledon. Basel played faster than any tour event this year, and he took advantage. In between, he suffered through a 1-7 stretch in which he lost five straight tiebreaks and saw his double-fault rate balloon into double digits.

Much of Mpetshi Perricard’s future success will depend on his ability to handle these ups and downs. So far, he has struggled a bit to avoid the bad patches that spell doom for one-dimensional players. In his limited tour-level action, he has won more service points (70.2%) than anyone except Jannik Sinner. Yet five men hold more reliably than the Frenchman does, even after an unbroken week in Basel. The successes of Milos Raonic and John Isner–and even Shelton last year–come from playing better than usual under pressure, something Mpetshi Perricard has yet to consistently demonstrate.

I do love talking about servebots serving service aces. But while everybody raves about the GMP serve, I keep thinking about the backhand.

On the one hand

Mpetshi Perricard is now the fourth-highest ranked man with a one-handed backhand. His shot is nothing like the graceful, big-backswing, Federer- and Gasquet-inspired strokes of Grigor Dimitrov and Lorenzo Musetti. He often does little more than set up the racket to block the ball back. Strong as he is, the resulting flat shot can be much more than a mere defensive maneuver.

A few generations ago, it was standard to see big servers with one-handers. Think Richard Krajicek or Greg Rusedski; you might even put Pete Sampras in that category. More recently, Ivo Karlovic sported a one-handed backhand, though he mostly hit slices. Christopher Eubanks fits a broadly similar mold. Now, though, one-handers are dying breed, with just nine representatives in the top 100 of the ATP rankings.

Unlike Musetti or Stefanos Tsitsipas, Mpetshi Perricard isn’t likely to inspire the next generation of one-handed stars. No one is going to call this guy a throwback. On a good serving day, the Frenchman’s highlight reel features barely any groundstrokes at all.

What, then, do the numbers say? Is the Mpetshi Perricard backhand any good? Would he be better off with a two-hander like Raonic’s, Isner’s, or Reilly Opelka’s? Or, to return to the question I started with: For someone who specializes in ending rallies before they begin, does his backhand even matter?

Safely hidden

When the Frenchman’s game plan is working, his backhand is tucked away, out of sight. No backhands are necessary when the serve doesn’t come back, and when he controls the point, he prefers the forehand. Setting aside service returns, few players avoid their backhands as scrupulously as Mpetshi Perricard does.

The average ATPer hits 44% of their groundstrokes from the backhand side. Here are the most backhand-shy men with at least 15 matches in the Match Charting Project database, along with some other big servers of note:

Player                      BH/GS  
Ivo Karlovic                30.1%  
Jack Draper                 32.5%  
Ryan Harrison               35.2%  
Thiago Monteiro             35.5%  
Giovanni Mpetshi Perricard  35.5%  
Jaume Munar                 36.1%  
Vasek Pospisil              36.4%  
Alejandro Tabilo            37.1%  
Alexei Popyrin              37.3%  
Guido Pella                 37.4%  
Ben Shelton                 37.6%  
Maxime Cressy               37.9%  
…                                  
Christopher Eubanks         38.9%  
Matteo Berrettini           41.1%  
Milos Raonic                42.9%  
-- Average                  44.0%  
John Isner                  44.3%  
Reilly Opelka               45.6%  
Greg Rusedski               46.2%  
Nick Kyrgios                46.8%  
Pete Sampras                47.7%  
Richard Krajicek            48.3%  
Goran Ivanisevic            51.1%  
Mark Philippoussis          52.1%

Backhands per groundstroke is not the easiest stat to parse, because it is the product of so many different factors. Nearly everyone would like to keep their number low, so it’s partly a function of footwork and anticipation. (And sheer willingness to hit forehands from outlandish positions.) But it is also influenced by opponents, who will work more or less hard to find the backhand. Mpetshi Perricard’s place on this list, then, could be telling us various things. He hits his forehand when he can, and his movement is good enough to make it happen. Opponents might not be trying as hard as they could to force a backhand.

Yet another factor is how comfortable the player is with their slice. GMP hits his quite a bit, meaning that he unleashes the flat one-hander that much more rarely. The typical tour player hits their flat or top-spin backhand on 35% of groundstrokes. The Frenchman comes in at 25%, not as often as his most extreme peers, but in line with other big servers:

Player                      not-slice-BH/GS  
Ivo Karlovic                           6.1%  
Daniel Evans                          11.6%  
Milos Raonic                          20.2%  
Maxime Cressy                         20.4%  
Matteo Berrettini                     21.3%  
Grigor Dimitrov                       22.7%  
Corentin Moutet                       23.3%  
Christopher Eubanks                   23.6%  
Giovanni Mpetshi Perricard            25.2%  
Alexei Popyrin                        26.3%  
...
Bernard Tomic                         27.9%  
John Isner                            28.0%  
Ben Shelton                           28.5%  
Reilly Opelka                         31.5%  
-- Average                            34.7%

All of this is to say: Mpetshi Perricard hardly leans on the flat backhand. His serve keeps point short, and his preferences are for other shots. In the 138 points of the Basel final, he hit only 28 flat backhands, six of them on service returns.

Backhand impact

When the Frenchman is forced to hit a backhand (or chooses to–anything’s possible, I guess), the results aren’t great. When he goes for the flat backhand, he wins 43% of points, compared to a tour average of 49%. He takes more risks than his peers, but not overwhelmingly so: 9% of his one-handers end in a winner or forced error, while 12% are unforced errors. (Tour norms are 8% and 9%, respectively.)

These outcomes aren’t as extreme as his preferences. Of about 200 players with as many non-slice backhands in the MCP database, Mpetshi Perricard’s 43% comes in 21st from the bottom. Compared to other big servers, that win rate is positively respectable:

Player                      W/FE%   UFE%  inPointsWon%  
John Isner                   6.9%  12.8%         35.8%  
Milos Raonic                 7.3%  12.5%         40.4%  
Matteo Berrettini            4.8%  10.4%         42.5%  
Andy Roddick                 5.5%   7.8%         42.6%  
Felix Auger-Aliassime        6.0%   9.9%         43.4%  
Giovanni Mpetshi Perricard   8.9%  12.6%         43.5%  
Ben Shelton                  6.2%  11.1%         43.8%  
Nick Kyrgios                 7.9%  10.7%         43.9%  
Kevin Anderson               7.6%  11.0%         44.1%  
Hubert Hurkacz               6.2%  10.0%         45.6%  
-- Average                   7.3%   9.0%         48.6%  
Jack Draper                  6.5%   5.7%         49.1%

Against this group, the Frenchman’s winner (and forced error) rate really stands out. Given the outcomes when he doesn’t go for it, it’s possible he should be even more aggressive than he already is. Master tactician Milos Raonic took a similar tack, piling up as many unforced errors as GMP does, but without quite as many winners.

The picture is less rosy when we look at slice backhands. As noted, Mpetshi Perricard hits a lot of them–close to one-third of his groundstrokes from that wing. When he does, he wins 33% of points, compared to 42% for his peers. Only a handful of players have posted such low slice-backhand win rates, and they are mostly the names you would expect:

Player                      W/FE%   UFE%  inPointsWon%  
John Isner                   1.5%  11.1%         27.3%  
Christopher Eubanks          1.6%  10.7%         30.2%  
Kevin Anderson               3.2%   6.5%         31.4%  
Nicolas Jarry                4.0%  13.2%         32.7%  
Ivo Karlovic                 3.5%  12.0%         32.8%  
Giovanni Mpetshi Perricard   3.1%   3.9%         33.1%  
Ben Shelton                  2.0%   7.1%         33.3%  
...
Nick Kyrgios                 4.2%   6.1%         35.6%  
Felix Auger-Aliassime        3.6%   8.2%         38.1%  
Hubert Hurkacz               2.7%   3.9%         38.1%  
Milos Raonic                 4.7%   9.4%         40.3%  
Matteo Berrettini            2.8%   9.0%         41.5%  
-- Average                   3.3%   5.4%         41.6%

The Frenchman doesn’t miss much. Why just keep the ball in play, though, if you’re likely to lose the point anyway? By hitting so many slices, Mpetshi Perricard makes his flat-backhand numbers look better, but he probably doesn’t pick up any points by making the trade. Prolonging the point is a good strategy if you’re Casper Ruud–or, really, about 80% of the guys on tour. But if you play like GMP, it’s better to go big.

This is one way in which the one-hander may cost him. The two-handed backhand is particularly valuable in its ability to block overpowering shots without retreating to a fully defensive mode. While players with one-handers try to achieve the same thing with a slice, the stats tell us that it’s a poor imitation. The Frenchman’s in particular isn’t doing him any favors.

So, does it even matter?

Mpetshi Perricard doesn’t hit that many backhands, and he isn’t that much worse than average when he does. But, the margins in tennis are small, and the margins for big servers are smaller still. In 26 tour-level matches this year through the Basel final, GMP won exactly 50% of his points. (Not 50.1%, not 49.9%–50% on the dot.) Five players in the top 20 win 50.8% or less. That’s how close the Frenchman is to an even bigger breakthrough.

My backhand potency (BHP) stat quantifies the impact that each player’s (non-slice) backhands have on their broader results. The stat measures how often a shot ends the point in either direction, as well as what happens on the shot after that. Based on the matches we’ve charted this year, GMP’s BHP per 100 backhands stands at -4.3, one of the lower numbers on tour for players with at least 10 charted matches from the last 52 weeks:

Player                      BHP/100  
Nicolas Jarry                  -6.9  
Felix Auger Aliassime          -4.6  
Tallon Griekspoor              -4.6  
Flavio Cobolli                 -4.3  
Giovanni Mpetshi Perricard     -4.3  
Alexei Popyrin                 -4.2  
Dominic Thiem                  -4.1  
Botic Van De Zandschulp        -3.5  
Matteo Berrettini              -3.1  
Ben Shelton                    -2.4  
Stefanos Tsitsipas             -2.4

What does this mean for the bottom line? -4.3 BHP is equivalent to about -3 points per 100 backhands. Since he doesn’t hit many backhands, that’s about -1.1 per 100 points.

My best estimate, then, is that if we magically replaced the Frenchman’s backhand with a neutral one–say, that of Arthur Fils–he’d pick up 1.1 more points per 100. Instead of winning 50% of points at tour level, he’d win 51.1%. That isn’t good enough to crack the top 10, but it would probably get him into the top 20.

Quantifying the impact of slices is tougher, because the more conservative shot is less likely to end the point immediately, or even on the next shot. If we figure that Mpetshi Perricard’s slice is roughly the same distance below average as his flat backhand, that’s another 0.5 or 0.6 points per 100 he could gain by acquiring a tour-average shot. Daniil Medvedev has hung in the top five in the ATP rankings while winning 51.9% of points. Stringing all of these assumptions together, we can start to see how a capably-backhanded GMP could reach that level.

The bad news for the Frenchman is that climbing the ranks is hard. Mpetshi Perricard is the worst returner in the top 50, and it isn’t even close. He breaks in about 10% of his return games; no one else is below 14%. Earlier this year, I wrote about the similar challenges facing Ben Shelton: Historically, a lot of players have arrived on tour with big serves, huge potential, and tons of hype. Few of them have been able to shore up their weak points enough to crack the top ten, let alone achieve greater feats.

The good news: There is so much room for improvement. Even without polishing the strokes themselves, it’s possible that a more aggressive set of tactics could win him a few more points on return. In yesterday’s loss to Karen Khachanov, the Frenchman won the first set despite picking off just two of 37 return points. One-dimensional servebot or not, he can learn to do better than that.

* * *

Subscribe to the blog to receive each new post by email: