I wrote last week about the decline of specialization on the men’s tour. I proposed that we see more good all-around players because, as the overall level improves, there’s less relative value in being a one-dimensional servebot or dirtball grinder.
A few people responded–and I paraphrase, slightly: It’s the surfaces, stupid.
Everybody seems to agree that at some point, let’s say between peak Sampras and peak Djokovic, surface speeds converged. Hard courts got slower, and some grass courts got slower, too. Serve-and-volleying mostly disappeared, and grinding baseline play took over.
The only debate, it seems, is why. Was it a conspiracy to give the fans (well, all the fans except for the ones complaining) what they wanted? Is it the balls? The rackets? The strings?
I’ve always been skeptical of the conspiracy theory. More generally, I have been–and still am–skeptical that playing conditions have changed that much. Just because everybody believes something–even if those people are top-ranked players and well-respected pundits–doesn’t make it true. The historical record shows that styles have changed, but it’s much harder to marshal evidence that the surfaces themselves are meaningfully different than they were 20 or 30 years ago.
A quick review
I’ve looked at this stuff before. Here’s a quick summary:
- The Mirage of Surface Speed Convergence (2013): I compared ace rates and break rates on hard and clay courts for pairs of players, 1991-2012. I found that the difference between hard courts and clay courts had, if anything, slightly widened, even though the conventional wisdom of convergence was fully in place by then.
- The Grass is Slowing: Another Look at Surface Speed Convergence (2016): I wish I had named this differently, because I didn’t show that the grass slowed, I showed that rally lengths at Wimbledon (and to some extent at the hard-court slams) were converging with those at Roland Garros. It was my first stab at the problem using Match Charting Project data, which meant it used rally length, instead of ace and break rates. However, it relied on limited data, which meant there were heavy biases in which players it measured.
- Surface Speed Convergence Revisited (2023): With more MCP data, I worked out a simple model of how much surface affected rally length, and how the effect had changed over time. Now without the selection bias, I showed that in both men’s and women’s tennis, the influence of surface on rally length had shrunk.
Pick your stat
To grossly oversimplify: If you look at ace rate, there’s no evidence of surface convergence. If you look at rally length, there is.
I didn’t want to rely on a 2013 mini-study for the ace-rate conclusion, so I came up with some new fodder.
My surface-speed ratings are based entirely on ace rate. Originally, this is because we don’t have better stats going very far back, while we do have ace rate for all ATP matches since 1991. The MCP has an increasing amount of coverage, but it is not complete, and the ace-based ratings have always seemed to capture surface-speed differences pretty well. There’s some noise, because there are only so many matches per tournament per year. But in general, they give us a pretty good idea of what’s going on.
The downside is that they are indexed to each year’s average. The rating for the 1991 edition of Wimbledon is 1.20, meaning that–controlling for the mix of players–there were 20% more aces than a 1991-average event. This year, Wimbledon’s rating was 1.12: 12% more aces than the 2025 average. But are those averages the same?
That question offers us a neat little experiment. Instead of indexing on a single-year average, why not do two years at a time? The pool of players was almost identical in 1992 as in 1991, so it’s a fair comparison. As it turns out, Wimbledon’s ace-based surface rating went down from 1.20 to 1.06 between 1991 and 1992. That kind of shift often happens due to randomness, but maybe it could be validated by a longer trend. Looking at two years at a time–1991 and 1992 together, 1992 and 1993 together, up to 2024 and 2025 together–allows us to make the same comparisons for the entire tour calendar, for a span of 35 years.
Well, in that span, ace rate has gone up quite a bit. And not just because mediocre servers have been replaced by better ones. On average, the same servers (against the same returners, though the returner effect is much smaller) have upped their ace rate about 2% every year. Not enough to notice as it happens, but enough to move the ATP tour average ace rate from below 7% in 1991 to a bit over 10% today. Some of the difference is due to the tournament mix–a shorter clay calendar, mostly. But I ran the same analysis on a core group of 15 events that have been in the same place since 1991, and the controlled-for-players increase is still 1.6% per year.
What about convergence, taken literally? Have faster events gotten slower, while slower events have sped up?
Nope! The variance between tournament ratings is almost exactly the same in 2024-25 as it was in 1991-92. An example: Back then, Wimbledon’s two-year average was 1.13, while Monte Carlo was 0.58. Over the last two years, Wimbledon’s rating has been 1.14, with Monte Carlo at 0.57.
It’s the strings…
How do we reconcile the evidence that ace rate has gone steadily up, while rally length has also increased?
Setting aside laboratory-type measurements (like CPI/CPR, which we don’t have far enough back, anyway), the purest way to measure court speed is ace rate. A slow court keeps the ball on the ground longer and slows down the rest of its trajectory. Returning is all about reaction time, and ace rate tells us whether returners physically got there or not. That’s why there are, reliably, so many more aces on hard and grass courts than on clay, and on faster hard courts than slower hard courts.
Now, it could be that players have gotten stronger, serve tactics have gotten less predictable, and racket/string technology allows servers to put the ball in the corner more often. All of that is probably true, so the 2%-per-year average likely overstates the change in surface. The ace increase might entirely be attributable to training and tech. But if you want to argue that surfaces have gotten slower, you’ve got an uphill battle to explain how aces have gone so far in the wrong direction.
The rally-length trend is easier to explain. Unlike ace rate, shots-per-point isn’t just about how the ball interacts with the surface. It’s about tactics and spin.
And actually, tactics are themselves largely about spin. And spin, well, that brings us to polyester strings.
Modern topspin is possible largely thanks to polyester strings. The best-known milestone is Gustavo Kuerten’s 1997 French Open title, the first major won with a Luxilon-strung racket. It took a few years for everybody to make the switch, but polyester string was kryptonite for serve-and-volleying. Now it was possible to hit returns that dipped to the server’s feet at the net. All that topspin also made it tougher to move forward. More topspin meant that deep groundstrokes were higher-percentage shots, and that opponents needed to give up even more ground to comfortably handle them.
When I wrote about Lleyton Hewitt a few years ago, I showed how Hewitt forced Roger Federer to basically give up serve-and-volleying. That was 2002-05. If it hadn’t been Hewitt, it would’ve been someone else–or everybody else.
Less serve-and-volleying, safer groundstrokes, fewer net approaches overall … all that adds up to longer rallies. No surface change necessary.
… and the youth
Let me show you the graph from my decline-of-specialization piece again. Generally speaking, it shows how much serve skill is related to return skill. Higher numbers (closer to zero) indicate a closer relationship, or in tennis terms: more all-around players.
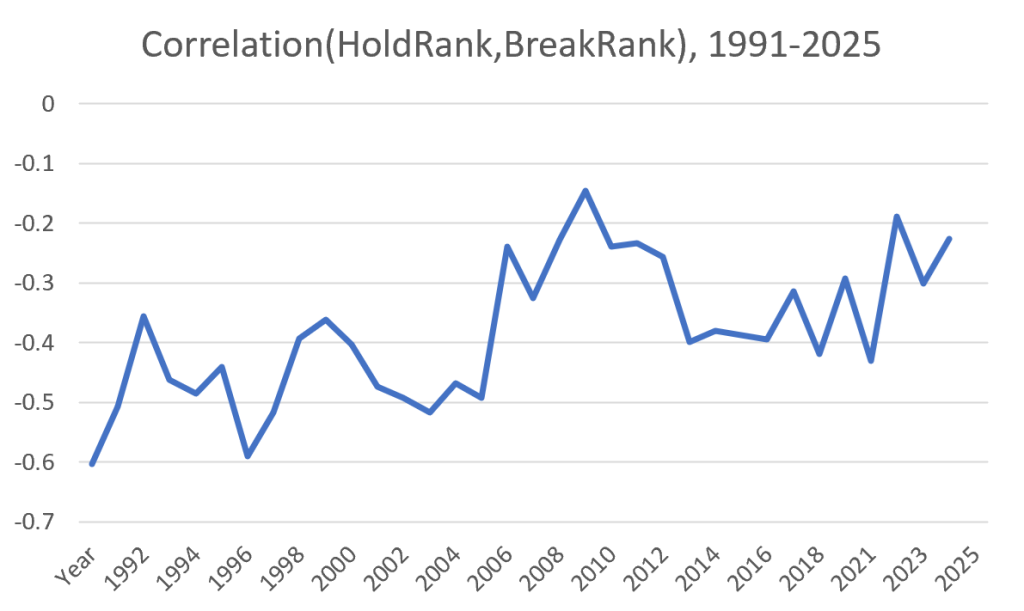
Someone on Twitter reasonably asked, what’s up with the peak around 2008-2010? It’s a noisy graph, but a plausible interpretation is that it breaks down into two segments. Up to 2005, most of the data points are between -0.4 and -0.5, with a couple on either side. Since then, the line rarely dips below -0.3. (2013-16 leaves some explaining to do.) Accept this reading, and 2008-10 isn’t a stand-alone peak, it’s the solidification of a new era.
What else was going on in 2008-10? Novak Djokovic won his first slam, and Rafael Nadal established himself as an all-court force. In short, this is when people really started talking about surface speed convergence. Probably not a coincidence.
But why then? Well, in the spring of 1997, the tennis world figured out that polyester strings weren’t just the misguided side-hustle of a bra-strap company. Players with an eye on the future started to switch.
When Guga lifted his trophy, Nadal was 11 years old. Djokovic was 10.
The learning curve
Professional tennis is tough. Players like their gear. They’re used to their gear. It took years for Federer to give up his 90-square-inch frame. Sampras never did abandon his 85-square-incher. When a pro finally does switch, the benefits are hardly instantaneous. It might even mean a temporary step back.
The ultimate advantages go to the tech-natives. For all of Kuerten’s success with Luxilon, he was never going to wring the full benefit of the new technology and the tactics that it implied. If a certain racket/string setup is optimal, the players who do the most with it will be those who built their entire games around it. I don’t know whether the critical age is 8, 11, or 14 (maybe it helped Federer that he was a bit of a late bloomer), but it definitely isn’t 20 or 25.
Check out the rally-length graph (based on slam finals) from my 2016 piece:
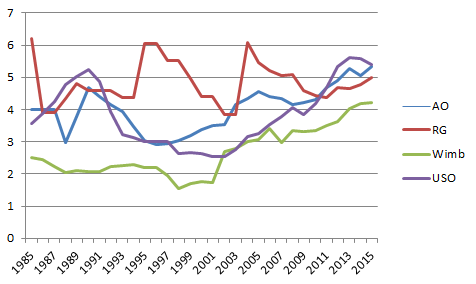
Wimbledon went from a low in 1998-2001 to a completely different level by 2006-08. Not a coincidence. The slam-finals graph tells the story of a select few guys, but by the late 2000’s, a whole generation of polyester natives–Djokovic, Nadal, Murray, Nalbandian, Berdych, Ferrer, Monfils–had taken over.
None of this requires the surfaces to change one iota. Maybe fans or tournament directors wanted longer rallies, maybe they didn’t. They were going to get baseline tennis no matter what.
Playing styles converged because topspin-powered strategy works across surfaces in a way that no previous style did. Rallies got longer because the players who tried to shorten them were stranded in the forecourt. They fumbled half-volleys into the net or watched passing shots as they whizzed by. Surfaces ended up as the scapegoat for a new era, but they didn’t cause it.
jsackmann,
Thanks for the commentary on performance results. I’m curious if you reviewed court surface performance relative to ATP or Elo ranking?
Great piece Jeff,
I have a couple of questions/observations.
1) Wimbledon rally length data upticks in 2001, circa when they changed the grass and the bounce become more consistent/higher, which itself is perhaps separate from speed (although lower bounces are perceived as faster I believe), but would also put a dampener on ace-rates given returners can stand deeper and react without poor bounces. How does return position (i.e., the deeper positions of today affect ace-rates?) I know Medvedev is one of the least-aced guys, which is partly explained by being 6’6” I suppose, but I wonder if deeper positions mean players don’t TRY and ace as much in certain scenarios. Maybe not widespread enough to move the needle on a tour average, but return positions in general have probably shifted back a little, and that probably helps returners get aced a little I would think (but maybe not, given the angles open up. I’m spitballing).
2) Matt Willis put out an interesting trend since 2016 on serve speeds since 2015, which had some big increases;(https://x.com/mattracquet/status/1904605185801884097)
Also this little blurb: “Probably craziest of all: the average 1st serve speed at the US & Australian Open in 1999 was 105mph (169kph), just 4mph (6kph) faster than the Miami Top 10’s average *2nd serve*(!) speed in 2025. Wild evolution over 26 years.”
You’ve probably done something about charting on average-serve-speed and ace-rate correlation?
Then there is the talk of the balls acting like “shuttlecocks” since Covid. Still flying off the racquet (where ball speed is measured), but slowing more through flight, which is prompting players to look for more power (Babolat’s, etc.,) but would also square with the fact that serve speeds at M1000s have increased ~5mph in the last few years, but ace rates have HELD in that time (or even slightly gone lower) (Source: https://www.youtube.com/watch?v=PoVltsavDRI).
Anyway, this is all a bit scattered as I’m typing-as-I’m-thinking, but my hunch seems to be: ball speeds are way up, deep return positions + taller players (reach) + (arguably) more athletic players are up, but ace rates haven’t gone up THAT much, so perhaps conditions (courts/balls) ARE much slower in isolation, but players are serving much harder because of technology to overcome that.
Thanks Hugh.
Does the rally length data actually increase right in 2001, or is that just a starting point for a lot of stats? (for instance, I frequently see the stat about S&V rates, comparing 2001 to the present). In any case, ace rate (controlling for player) went *up* from 2000 to 2001.
I’ll need to see what I can do with serve speed data.
Overall ace rates may have held, but controlling for player, they have gone up almost every single year for 35 years. IOW, the player mix has changed–to the decline-of-specialization point, there’s less benefit to being a servebot, so the Rusedski/Ivanisevic/Krajicek group wasn’t replaced, at least not in the same numbers. If the player mix hadn’t changed, ace rate would’ve increased from ~7% to somewhere between 12% and 14%, instead of 10%.
It’s possible that increase in serve speed (made possible by bigger rackets with weight distribution that is easier to control?) explains the ace increase, but there’s no question the ace increase is there. So there’s still no evidence for surfaces (or balls, etc) being slower, unless you think the serve speed increase erases it *and* explains the increase in aces.
I think your notion that play styles converging is 100% true and explains the similarities across surfaces regarding rally length data.
But your last sentence is exactly my hunch, and where I think an interesting analysis would lie. (Have you looked at data on the ITF type 3 ball introduced in 2002, designed to give returners 10% more time ?)
An example from data I have: we can say de Minaur is not a servebot as a contemporary player tag, with an average of 3.4 aces/match in 2025, but his average first-serve speed in ATP matches for 2025 (196km/h) would be close to servebot speed territory in the 90s I assume (plus, his fastest this year — 136mph! — is probably a top-10 tour leader in some 90s years).
Were 90s players serving this fast but averaging aces this low?
Now it’s true Demon isn’t the most accurate server (he’s around 65cm from the line on a first serve), but he was just as inaccurate in 2022 where he averaged 188km/h and only garnered 2.1 aces/match. GMP is virtually as accurate (or innacurate: 64cm) as de Minaur, but *averages* 134 mph on his first serve for 12.9 aces/match. It is surely true that some of a servebots’ edge is as much about their accuracy as their speed (and thus, where poly may also be of assistance to modern servers), but serve speed itself would have some correlation to aces no doubt.
To explain the *same player increasing ace % over time* phenomenon… are players continually squeezing the juice out of gear (strings and racquets), as well as advances in fitness training and improved technique to gain speed over the course of their careers? ala De Minaur but for everyone.
One think I liked about the Paris Olympics is that they had reaction time off the serve… If we had had this over the years, we could have seen if balls are slower through the air/hard courts slowing down balls after the bounce, despite faster speeds off the racquet, and if deeper positions/more time to react were correlating with less aces).
An important addition to my own comment: demon’s first serve % went DOWN 4% this year compared to 2022. A player’s ace-rates could go up because the player hit faster, or maybe they are making more first-serves? I think I remember reading that first-serve %’s started to steadily climb with the intro of poly.
Your observations are very interesting. Thank you.
We’re missing a lot of data. Players have been complaining about the balls for some time, especially about how they absorb moisture and “inflate,” becoming larger and flying slower. So, a ball might not be inherently slow, but it can slow down until it’s replaced. In short, we need data on aces with new balls and with “old” balls.
Hello Jeff,
Foremost, it’s insane what you have done with all of this tennis data. I’m really a big fan and admirer.
With some friends, we’ve been trying to replicate a forecast algorithm just for finals and semi-finals of tournaments and want to incorporate a Tiredness factor (considering time spent on court across the tournament, rest time in between tournaments, or potentially even using computer vision to measure distance done by a player across a tournament). Do you know if this has been done by you or anyone else to incorporate in forecasts?
Would love to know!
Thank you.
Best regards,
Elliot Sezalory
I’m sure people have done it for betting models, though I’m not sure if it has been published. I’ve looked a little at fatigue as it applies to the next match following very long matches, but nothing beyond that.
It’s impossible to argue against the advancement in racquet and strings and the change it brings to play. However, my humble tennis bettor eyes will always say “it’s the ball”. For years MLB tried to blame increased home run rates on the ball to alleviate the notion of rampant PED use among players. But on the ATP/WTA tour I think it’s a good argument. Is it “ball speed” more than “court speed?” I’m not going to sit hear and say that factors like surface type, weather and altitude are not relevant, but from tournament to tournament I’m sticking with the ball being the major issue.
Articolo come sempre moto interessante . A mio avviso gli ace non hanno nessuna correlazione con la velocità della superficie perchè il giocatore può decidere se provarlo o no e quindi dipende troppo dalla tattica di quel match . Probabilmente includendo tutti i punti vinti dal battitore entro i 3 colpi ( servizio + i due successivi ) si potrebbe avere un dato più veritiero . Comunque è sicuramente la combinazione palla + superficie che determina questo avvicinamento .
Comunque complimenti .