The human brain is a trend-spotting machine. A couple of groundstroke errors in a row, and fans and commentators conclude that a player’s stroke has gone off the rails, perhaps because her opponent has exerted just the right pressure. Shots, we say, can “break down,” and even that opponents can “break them down.”
Except… an awful lot of the trends we spot are mirages, misguided attempts to make sense of noisy data. Yesterday, we learned that first serves aren’t streaky. For pros, missing one doesn’t make it more likely that you’ll miss the next; women even tend to make slightly more first serves after misses. So, what about groundstrokes?
It’s a trickier phenomenon to pin down, because unlike first serves, forehands (or backhands) are not all created alike. After missing one forehand, you might not see one on the next point or two. Or if you do, it could be at a different angle, a different height, a different court position, and so on. Still–and long-time readers are going to struggle to believe me on this–there is a detectable effect! Really!
Based on women’s matches since 2020 logged by the Match Charting Project, if a player makes a forehand unforced error on one point, she is 0.45 percentage points more likely to make a forehand unforced error on her next point with a forehand in it. It’s a tiny shift, representing about a 2% tick upward from the typical error rate around 20%, but it is real. The results are about the same (slightly weaker, but in the same neighborhood) for backhands. Men are in the same neighborhood, as well.
But wait: If we control for set, establishing our expected error rates for a single set rather than the entire match, the effect shrinks, and for men, it vanishes almost entirely.
This is good news and bad news. There’s little or no short-term influence of one error on the next opportunity to hit that shot. But error rates do drift over the course of the match.
Drift away
Splitting matches into chunks of 20 forehand points, error rates move around quite a bit more than that sub-half-point shift. Without controlling for set, the typical WTAer sees her forehand UFE rate jump around 1.4 percentage points more than would be expected from chance alone. That’s still not detectable within a single match, but it is a meaningful difference in the long run. Over the last 52 weeks, the range in UFE rate between the most error-prone player (Anna Kalinskaya) and the least (Belinda Bencic) is only 9 percentage points. 1.4 points represents a jump of several places at most positions on the leaderboard.
A bunch of subsequent tests reveal some aspects of that drift. For one thing, it’s usually not a single stroke that ebbs and surges. When a player starts making more errors, both wings suffer. There’s a hint in the men’s data that forehand and backhand error rates don’t quite move in lockstep, but the data is inconclusive.
It’s also clear that players seize on their opponents’ sloppiness. You can probably imagine situations where gaffes seem contagious and no one can keep the ball in the court, but typically, one player tightens up his (or her) game while the other one struggles. I don’t know which direction the causation points: Does one player “break down” the other? Does she take advantage of her opponent’s errors and play more conservatively? Anything along those lines is just speculation at this point.
The strongest effects, though, were somewhere I didn’t intend to look. Error rates shift chronologically, both across sets and within them, in predictable ways.
Tightening up
These graphs show the trend in relative unforced error rates by set, for both men and women:
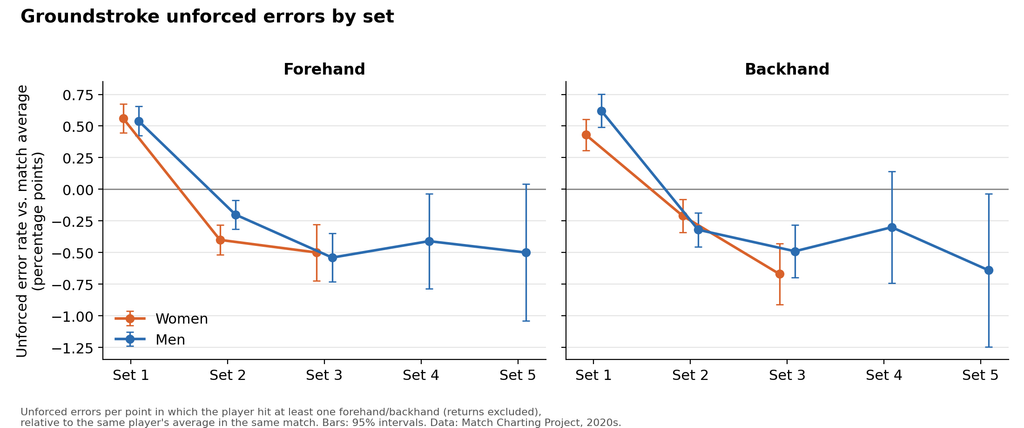
On both wings, players make more errors in the first set. Women improve their forehand error rate by almost a full percentage point between the first and second sets. While there’s not much movement after the second set, the rates stay well below the first-set standard.
Before we speculate about the causes, let me show you another pair of plots, now comparing relative error rates within sets, by pairs of games:
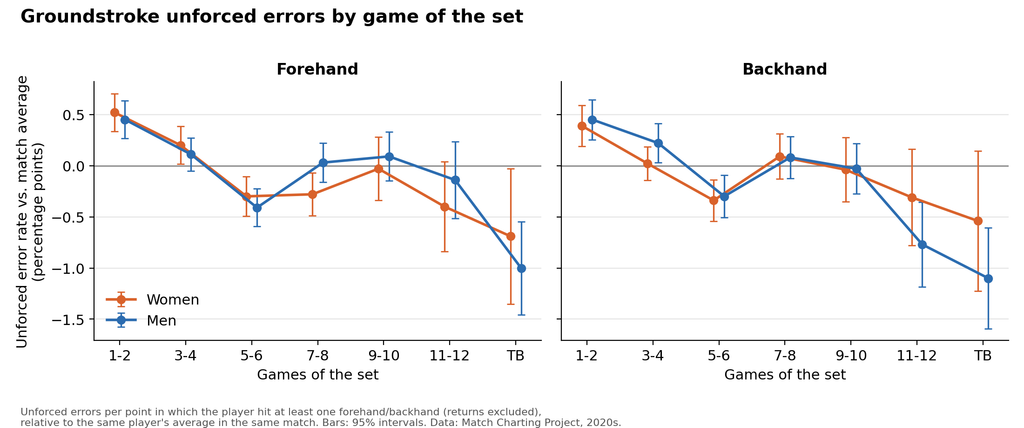
Again, we start high then tack lower. Though it’s not an unequivocal downward trend, the first two games are consistently the most error-prone, and tiebreaks are the least. (Players become more conservative in tiebreaks by just about every possible metric, from serve speed to rally length to errors.)
Combine those two effects, and you have some sloppy opening games. Here’s one more plot, using WTA data, showing each set broken into chunks of 10 forehand points. The top left corner is the beginning of the first set; the bottom right is the end of the third. Red means more errors than expected (the numbers are percentage points), blue means less:
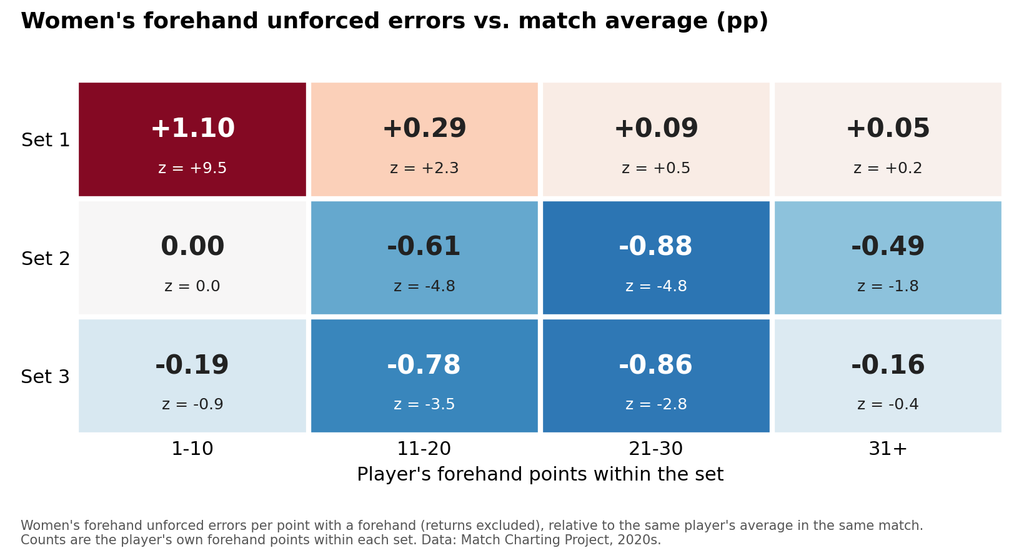
Every set tightens up as it goes along, but my oh my are those first ten points brutal. These shifts account for much of the “drift” within matches. Error rates move for reasons other than chronology, but chronology is a single factor that seems to affect a large number of players.
Sloppy or aggressive?
High error rates are not inherently bad: Jelena Ostapenko has made a career out of winning matches when she loses one of three points with a (wild) miss. The trick is to pair errors with winners, to take the good aggression with the bad.
That’s not what’s happening here! For women, on both wings, winner rates are at their lowest in the first set. Within sets, winner rates are lower in the first two games than they are until 5-5, when tiebreak caution starts to take over.
These numbers strongly point toward a “warm-up” effect at the beginning of the match and a smaller “re-set” effect at the start of each subsequent set. Maybe that’s understandable: No amount of actual warming up can prepare you for the reality of a new opponent’s individual mix of speed, spin, and angles. And despite the dark red of that upper-left-hand heatmap cell, we’re still only talking about a shift of one percentage point: Enough to pick up across 4,000 charted matches, but far too small to notice even in a fortnight of attentive tennis-watching.
What about the players?
Up to this point, we’ve been talking about averages. We don’t have enough data to identify tendencies for most players, but we can find some.
One of the strongest individual-player findings for women is that Coco Gauff’s error rates drift quite a bit within a match: about three percentage points compared to less than two for the average player. Gauff is slightly more prone than average to a sloppy start, as well, but the full-match metric excludes the first 20 baseline points, so her variance goes far beyond that.
By contrast, Aryna Sabalenka and Iga Swiatek are remarkably steady, showing effectively no in-match variation in error rates beyond what would be expected from chance.
Sabalenka also stands out in that her aggression (winners plus errors) goes up under pressure, defined as the ninth game of a set or later, with the score within one game. The effect is small–a bit more than one percentage point–but it is striking because the average trend under pressure is negative. Gauff, Elena Rybakina, and Jessica Pegula all score about one percentage point in the opposite direction, more conservative under pressure than the average player. Iga is almost precisely average.
I haven’t said much in this post about men, because the trends are generally the same across both tours. Still, there are some interesting individual numbers for ATPers.
Both Stefanos Tsitsipas and Grigor Dimitrov see even more error-rate drift within a match than Gauff. Lorenzo Musetti is the slowest starter, committing the most errors (relative to match averages) in his first 20 chances per match of all men for whom I have a lot of data. It’s suggestive, though hardly conclusive, that those three outliers all have one-handed backhands. I can sympathize: If I play a match on Monday morning, my backhand starts rounding into form on Wednesday afternoon. (Tsitsipas and Dimitrov, for what it’s worth, aren’t slow starters; their error-rate drift comes later.)
A slow start isn’t necessarily bad. Second on that list behind Musetti is Carlos Alcaraz, even though Carlitos scores about average for general within-match drift.
Jannik Sinner’s career of bloodless executions turns up in the data as well. His within-match drift is the lowest (tied with Felix Auger-Aliassime, surprisingly enough) of all players with enough data. In the big moments, he grinds you down, committing fewer errors under pressure and improving his winner-errors ratio. He isn’t the most conservative in the big moments, though: That honor belongs to Novak Djokovic, with the perpetually cautious Alexander Zverev right behind him.
Circling back to where we started: Pro groundstrokes don’t really break down. They take a few games to reach optimal form, and on occasion, they rattle a bit. Most of the apparent trends we spot as fans are fake. But in this case, there are indeed a few drops of water in the desert of statistical noise.