The Effects (and Maybe Even Momentum) of a Long Rally

Italian translation at settesei.it

In yesterday’s quarterfinal between Simona Halep and Victoria Azarenka, a highlight early in the third set was a 25-shot rally that Vika finished off with a forehand winner. It was the longest point of the match, and moved her within a point of holding serve to open the set.

As very long rallies often do, the point seemed like it might represent a momentum shift. Instead, Halep sent the game back to deuce after a 10-stroke rally on the next point. If there was any momentum conferred by these two points, it disappeared as quickly as it arose. It took eight more points before Azarenka finally sealed the hold of serve.

Does a long rally tell us anything at all? Does it have predictive value for the next point, or even the entire game, or is it just highlight-reel fodder that is forgotten as soon as the umpire announces the score?

To answer those questions, I delved into the shot-by-shot data of the Match Charting Project, which now contains point-by-point accounts of nearly 1,100 matches. I identified the longest 1% of points–17 shots or longer for women, 18 shots for men–and analyzed what happened afterwards, looking for both fatigue and momentum effects.

The next point

There’s one clear effect of a long rally: The next point will be shorter than average. The 10-shot rally contested by Vika and Simona yesterday was an outlier: Women average 4.45 shots on the point after a long rally, while the overall average (controlled for server and first or second serve) is 4.85. Men average 4.03 shots on the following point, compared to an average of 4.64.

For women, fatigue is also a factor for the server. Following a long rally, women land only 61.3% of first serves, compared to an average of 64.6%. Men don’t exhibit the same fatigue effect; the equivalent numbers are 62.3% and 62.2%.

There’s more evidence of an immediate fatigue factor for women, as well. The players who win those long rallies are slightly better than their opponents, winning 50.7% of points on average. Immediately after a long rally, however, players win only 49% of points.  It’s not obvious to me why this should be the case. Perhaps the player who won the long rally worked a bit harder than her opponent, maybe putting all of her remaining effort into a groundstroke winner, or finishing the point with a couple of athletic shots at the net.

In any case, there’s no equivalent effect for men.  After winning a long rally, players win 51.1% of their next points, compared to an expected 50.8%. That’s either a very small momentum effect or, more likely, a bit of statistical noise.

Both men and women double fault more often than usual after a long rally, though the effect is much greater for women. Immediately following these points, women double fault 4.7% of the time, compared to an average of 3.3%. Men double fault 4.5% of the time after a long rally, compared to an expected rate of 4.2%.

Longer-term momentum

Beyond a slightly effect on the characteristics of the next point, does a long rally influence the outcome of the game? The evidence suggests that it doesn’t.

For each long rally, I identified whether the winner of the rally went on to win the game, as Vika did yesterday. I also combined the score after the long rally with the average rate of points won on the appropriate player’s serve to calculate the odds that, from such a score, the player who won the rally would go on to win the game. To use yesterday’s example, when Azarenka held game point at AD-40, her chances of winning the game were 77.6%.

For both men and women, there is no significant effect. Women who won long rallies went on to win 66.2% of those games, while they would have been expected to win 65.7%. Men won 64.4% of those games, compared to an expected rate of 64.1%.

With a much larger dataset, these findings might indicate a very slight momentum effect. But limited to under 1,000 long-rally points for each gender, the differences represent only a few games that went the way of the player who won the long point.

For now, we’ll have to conclude that the aftereffects of a long rally have a very short lifespan: barely one point for women, perhaps not even that long for men. These points may well have a greater effect on fans than they do on the players themselves.
Is Kevin Anderson Developing Into an Elite Player?

Italian translation at settesei.it

With his upset win over Andy Murray on Monday, Kevin Anderson reached his first career Grand Slam quarterfinal. At age 29, he’ll ascend to a new peak ranking, and with a bit of cooperation from the rest of the draw, one more win could put him in the top ten for the first time.

Anderson has been a stalwart in the top 20 for two years now, but this additional step comes as a bit of a surprise. Despite the overall aging of the ATP tour and the emergence of Stan Wawrinka as a multi-Slam champion, it’s still a bit difficult to imagine a player in his late twenties taking major steps forward in his career.

What’s more, Anderson’s game is very serve-dependent. With an excellent backhand, he isn’t as one-dimensional a player as John Isner, Ivo Karlovic, or perhaps even Milos Raonic, but it’s much easier to categorize him with those players than with more baseline-oriented peers.

In today’s game, it is very difficult to reach the very top ranks without a quality return game. Tiebreaks are too much of a lottery to depend on in the long-term; you have to consistently break serve to win matches. As I wrote in a post about Nick Kyrgios earlier this year, almost no players have finished a season in the top ten without winning at least 37% of return points. Anderson has achieved that mark only once, in 2010. Entering the US Open this year, he was winning only 34.2% of return points.

The only top-ten player this year with a lower rate of return points won is Raonic, at 30.2%. Raonic is a historical anomaly, and as his tiebreak winning percentage has tumbled, from a near-record 75% last year to a more typical 51% this year, his place in the top ten is in jeopardy as well. In other words, the only servebot in the top ten has to rely on plenty of luck–or outstanding, perhaps one-of-a-kind skills in the clutch–to remain among the game’s elite.

Anderson is a more well-rounded player than Raonic, and he wins more return points than that. But he still falls well short of the next-worst return game in the top ten, Wawrinka’s 36.7%. The 2.5 percentage points between Anderson and Wawrinka represent a big gap, almost one-fifth of the entire range between the game’s best and worst returners.

The less effective a player’s return game, the more he must rely on tiebreaks to win sets, and that’s one explanation for Anderson’s success this season. His 62%(26-16) tiebreak winning percentage in 2015 is the best of his career, and considerably higher than his career tiebreak winning percentage of 54%. Again, it sounds like a small difference, but take away three or four of the tiebreaks he’s won this year, and he no longer reached the final at Queen’s Club … or might not be preparing for a quarterfinal in New York.

Very few players have managed to spend meaningful time in the top ten while depending so heavily on winning tiebreaks. Another metric to help us see this is the percentage of sets won that are won in tiebreaks. Entering the US Open, just over 25% of Anderson’s sets won were won in tiebreaks. Only four times since 1991 has a player sustained a rate that high and ended the year in the top ten: Raonic last year, Andy Roddick in 2007 and 2009, and Greg Rusedski in 1998.

In fact, between 1991 and 2014, only 17 times did a player finish a season in the top ten with this rate above 20%. Roddick represents five of those times, and almost all, except for Roddick at his peak, were players who finished outside the top five. Wawrinka’s and Raonic’s 2014 seasons were the only occurrences in the last decade.

The one ray of light in Anderson’s statistical profile this season is a significantly improved first serve. His 2015 ace rate is over 18%, compared to the 2014 (and career average) rate of 14%. His percentage of first-serve points won is up to 78.8%, from last season’s 75.4% and a career average of 75.8%.

This is a major improvement, and is the reason why he is one of only five players on tour (along with Isner, Karlovic, Roger Federer, and Novak Djokovic) winning more than 69% of service points this year. In many ways, Anderson’s stats are similar to those of Feliciano Lopez, but the Spaniard–another player who has long stood on the fringes on the top ten–has never topped 68% of service points won for a full season.

If Anderson can sustain this new level of first-serve effectiveness, he will–at the very least–continue to see a bit more success in tiebreaks. A tiebreak winning percentage higher than his career average of 54% (though still probably below his 2015 rate of 62%) will help keep him in the top 15. However, even for the best servers, tiebreaks are often little more than coin flips, and players don’t join the game’s elite by relying on coin flips.

As his quarterfinal appearance at the Open shows, Anderson is moving in the right direction. It’s easy to see a path for him that involves ending the season in the top ten. But to move up to the level above that, following the path of someone like Wawrinka, he’ll need to start serving like peak Andy Roddick, or–perhaps just as difficult–significantly improve his return game.

Break Point Persistence: Why Venus is Better Than Her Ranking

Some points matter a lot more than others. A couple of clutch break point conversions or a well-played tiebreak make it possible to win a match despite winning fewer than half of the points. Even when such statistical anomalies don’t occur, one point won at the right time can erase the damage done by several other points lost.

Break points are among the most important points, and because tennis’s governing bodies track them, we can easily study them. I’ve previously looked at break point stats, with a special emphasis on Federer, here and here. Today we’ll focus on break points in the women’s game.

The first step is to put break points in context. Rather than simply looking at a percentage saved or converted, we need to compare those rates to a player’s serve or return points won in general. Serena Williams is always going to save a higher percentage of break points than Sara Errani does, but that has much more to do with her excellent service game than any special skills on break points.

Once we do that, we have two results for each player: How much better (or worse) she is when facing break point on serve, and how much better (or worse) she is with a break point on return.

For instance, this year Serena has won 2.8% more service points than average when facing break point, and 7.5% more return points than average with a break point opportunity. The latter number is particularly good–not only compared to other players, but compared to Serena’s own record over the last ten years, when she’s converted break points exactly as often as she has won other break points.

Serena’s experience isn’t unusual. From one year to the next, these rates aren’t persistent, meaning that most players don’t consistently win or lose many more break points than expected. Since 2006, Maria Sharapova has converted 1% fewer break points than expected. Caroline Wozniacki has recorded exactly the same rate, while Victoria Azarenka has converted 2% fewer break points than expected.

On serve, the story is similar, with a slight twist. Inexperienced players seem to perform a little worse when trying to convert a break point against a more experienced opponent, so most top players save break points about 4% more often than they win other service points. Serena, Sharapova, Wozniacki, Azarenka, and Petra Kvitova all have career rates at about this level.

Unlike in the men’s game, there’s little evidence that left-handers have a special advantage saving break points on serve. Angelique Kerber is a few percentage points above average, but Kvitova, Lucie Safarova, and Ekaterina Makarova are all within one percentage point of neutral.

While a few marginal players are as much as ten percentage points away from neutral saving break points or converting them, the main takeaway here is that no one is building a great career on the back of consistent clutch performances on break points. Among women with at least 250 tour-level matches in the last decade, only Barbora Strycova has won more than 3% more break points (serve and return combined) than expected. Maria Kirilenko is the only player more than 3% below expected.

This analysis doesn’t tell us anything very interesting about the intrinsic skills of our favorite players, but that doesn’t mean it’s without value. If we can count on almost all players posting average numbers over the long term, we can identify short-term extremes and predict that certain players will return to normal.

And that (finally) brings us to Venus Williams. Since 2006, Venus has played break points a little bit worse than average, saving 2% more break points than typical serve points (compared to +4% for most stars) and winning break points on return 3% less often than other return points.

But this year, Venus has saved break points 17% less often than typical service points, the lowest single-season number from someone who played more than 20 tour-level matches. That’s roughly once per match this year that Venus has failed to save a break point that–in an average year–she would’ve saved.

There’s no guarantee that saving those additional break points would’ve changed many of Venus’s results this year, but given the usual strength of her service game, holding serve even a little bit more would make a difference.

This type of analysis can’t say whether a rough patch like Venus’s is due to bad luck, mental lapses, or something else entirely, but it does suggest very strongly than she will bounce back. In fact, she already has. In her successful US Open run, she’s won about 66% of service points while saving 63% of break points. That’s not nearly as good as Serena’s performance this year, but it’s much closer to her own career average.

Like so many tennis stats that fluctuate from match to match or year to year, this is another one that evens out in the end. A particularly good or bad number probably isn’t a sign of a long-term trend. Instead, it’s a signal that the short-term streak is unlikely to last.

Ivo Karlovic and His Remarkable 10,466* Aces

Italian translation at settesei.it

Here’s the official story: This week, Ivo Karlovic crossed the much-heralded 10,000-ace milestone. Next up is the all-time record of 10,183 aces, held by Goran Ivanisevic.

Karlovic is one of the greatest servers in the game’s history, and he has in fact hit more than 10,000 aces. Ivanisevic was really good at serving, too, and he might even hold the all-time record. But when it comes down to the details in this week’s ATP press releases, all the numbers are wrong.

Last year, Carl Bialik laid out the two main problems with ATP ace records:

  • The ATP doesn’t have any stats from before 1991. (Ivanisevic started playing tour-level matches in 1988.)
  • ATP totals don’t include aces from Davis Cup matches, even though Davis Cup results are counted toward won-loss records and rankings.

I’ll add one more: There are plenty of other matches since 1991 with no recorded ace counts, too. By my count, we don’t have stats for 14 of Ivanisevic’s post-1991 matches. (They’re not on the official ATP site, anyway.) That doesn’t count Davis Cup, the Olympics (also no stats), and the now-defunct Grand Slam Cup.

If you like tracking records and comparing the best players from different eras, tennis might not be your sport. All of these problems exist for players who retired only recently, and some of the issues persist to the present day. And if you want to compare Federer or Ivanisevic with, say, Boris Becker or–it’s tough to write this without laughing–Pancho Gonzalez, you’re completely out of luck.

We’ll probably never find ace totals from all of the missing matches. But it seems silly to pretend we can identify the true record-holder and celebrate when these “records” are broken when we so obviously cannot.

Approximate* career* totals*

What we can do is estimate the number of missing aces for each of the top contenders. In Ivanisevic’s case, his 1988-90 seasons, combined with Davis Cup and other gaps in the record, total nearly 200 matches. Even if we can’t pinpoint the exact number of uncounted aces, we can come up with a number that demonstrates just how far ahead of Karlovic he currently stands.

To fill in the gaps, I calculated each player’s rate of aces per game for each surface for every season he played. For 1988-90, I used 1991 rates. (This post at First Ball In, which I discovered after writing mine, suggests that players improve their ace rates the first few seasons of their careers, so we should adjust a bit downward. That may be right. A 5% penalty for Goran’s 1988-90 knocks off about 60 aces from his total below.)

Once we crunch the numbers, we get an estimated 2,368 aces in Ivanisevic’s 195 “missing” matches. That gives him a career total of 12,551–a mark Karlovic couldn’t achieve until the end of 2017, if then.

But wait–Ivo has some missing matches, too! The gaps in his record only amount to 21 matches, mostly Davis Cup. The same approximation method adds 466 aces to his record, meaning he hit that 10,000th ace back in June, in his second-rounder against Alexander Zverev. Even with those nearly 500 “extra” aces, Ivanisevic’s record is almost surely out of reach.

What about Pete Sampras? Officially, Pete is fifth on the all-time list, with 8,858 aces. But like Goran, he played a lot of matches before record-keeping began in 1991. His ace record is missing nearly 200 matches, as well.

In Sampras’s case, we can estimate that he hit 1,815 aces that aren’t reflected in his official total. (In line with the caveat regarding Goran’s total above, we might want to knock that total down by 50 to reflect the possibility that he hit more aces in 1991 than in 1988-90.)

Making similar minor adjustments to the other members of the top five, Federer and Andy Roddick, here’s what the all-time list should look like, at least in general terms:

Player      Official  Est Missing  Est Total  
Ivanisevic     10183         2368      12551
Sampras         8858         1815      10673  
Karlovic       10022          466      10488  
Federer         9279          524       9803  
Roddick         9074          694       9768  

Coincidentally, Karlovic is officially within 200 aces of  Ivanisevic’s all-time record, and while he really isn’t anywhere near the record, he is that close our estimate of Sampras’s second-place total.

We can be confident that Ivo is a great server. But if we can’t be sure of his own ace total, mostly amassed in the last decade, it seems foolish to pretend that we’ll know when–or even if–he breaks the all-time record.

The Almost Neutral Let Cord

Italian translation at settesei.it

Once I started charting matches–carefully watching and notating every shot–I thought I noticed a trend after “let” serves. It seemed that players missed far more first serves than usual after a let, and when players landed a post-let first serve, their offering was weaker than usual.

Now that we have nearly 500 pro matches in the Match Charting Project database, including at least 200 each from both the ATP and the WTA, there’s plenty of data with which to test the hypothesis.

To my surprise, there’s no such trend. If anything, players–men in particular–are more likely to make a first serve after a let cord. When they do, they are at least as likely to win the point as in non-let points, suggesting that the serve is no weaker than usual.

Let’s start with the ATP numbers. In over 1,100 points in the charting database, the server began with a let. He eventually landed a first serve 62.8% of the time, compared to 62.0% of the time on non-let points. When he made the first serve, he won 73.3% of points that began with a let serve, compared to only 70.6% of first-serve points when there was no let.

More first serves in, and more success on first serves. The latter finding, with its difference of 2.7 percentage points, is particularly striking.

Of the trends I had expected to see, only one is borne out by the data. Since a net cord let is only millimeters away from a fault into the net, it seems logical that net faults would be more common immediately after a let than otherwise. That is the case: 15.7% of men’s first serves result in faults into the net, but after a let,  that figure jumps to 17.0%.

When we turn to WTA matches with available data, we find that the post-let effect is even stronger. In non-let points, first serves go in at a 62.8% rate. After a first-serve let, players record a 65.3% first-serve percentage. Given that first-serve percentages are usually concentrated in a relatively small range, a difference of 2.5 percentage points is quite significant.

The WTA data tells a different story than the ATP numbers do when we look at the end result of those first serves. On non-let points, WTA players win first-serve points at a 62.8% rate, while after a first-serve let, they win these points at only a 61.8% clip. It may be that some women approach post-let first serves a bit more conservatively, and they pay the price by winning fewer of those points.

WTA players also appear to miss a few more post-let first serves into the net, though the difference is not as striking as it is for men. On non-let points, net faults make up 16.2% of the total, and after first-serve lets, net faults account for 16.7% of first serves. Of all the numbers presented here, this one is most likely to be no more than random noise.

It turns out that let serves don’t have much to tell us about the next serve or its outcome–and that’s not much of a surprise. What I didn’t expect was that, after a let serve, professionals are a bit more likely than usual to find success with their next offering.

If you like watching tennis and think this kind of research is worth reading, please consider lending a hand with the Match Charting Project. There’s no other group effort of its kind, and the more matches in the database, the more valuable the analysis.

Donald Young’s Perpetual Hopes and the Lefty Serve That Isn’t

Donald Young celebrated his 25th birthday last week, and if you’ve been following the ATP for any part of the last decade, you know all about his talent, his potential, and his underwhelming results. Every time he goes deep in a tournament–as he has in Washington this week, upsetting Kevin Anderson in three sets today–all that upside talk gets dredged up again.  Is this finally the breakthrough for which we’ve waited so long?

In general, it’s a safe bet to watch longer-term trends more closely than short-term peaks and valleys. So the short, obvious answer is: No, it’s unlikely to be a sign of much greater things to come. Still, Young has beaten three top-50 players this week, and it’s a good time to take a closer look at what might be holding him back.

A prime obstacle isn’t hard to identify. Donald has one of the weakest serves on the ATP tour. While that doesn’t automatically keep him out of the top fifty in the world, it sure doesn’t help. Young’s year-to-date ace percentage, 3.4%, is among the ten worst on tour, and with the exception of David Ferrer and Roberto Bautista Agut, none of the other players on that list are inside the top 35. This year’s number is no slump, as Young’s ace rate has been below 4% every year since 2009.

Another metric to indicate the effectiveness of a player’s service game is the ratio of service winning percentage to return winning percentage (SW/RW). If a player wins lots of service points, it might be due to a good serve, or it might owe to a strong overall game. This ratio gives us a rough measure of how much a player’s success on serve is due to the serve itself.

Coming into Washington this week, Young’s SW/RW was 1.49, one of the lowest marks of any left-handed tour regular in the last ten years. A few right-handers succeed while winning only 50% more service points than return points–including Ferrer and, for one season, Andy Murray–but the average player on tour wins roughly 73% more serve points than return points. Even Rafael Nadal hasn’t fallen below the 1.5 mark since 2005.

As Ferrer has demonstrated, a player with Young’s level of service success can have a very good career on tour. Yet Ferrer’s skillset is unusual, and importantly, he’s a righty.

Not every successful ATP left-hander is a big server. Nadal won dozens of titles before fully developing the serve he uses today. Neither Fernando Verdasco nor Jurgen Melzer, two lefties who cracked the top ten, are known for overpowering deliveries. But in the last decade, Nadal is the only left-hander to consistently succeed with a SW/RW under 1.6.

It’s a different story for righties. As we’ve seen, Ferrer is a perennial top player despite Young-like serve stats. Fabio Fognini, Nikolay Davydenko, and Lleyton Hewitt have all enjoyed solid seasons without greater serve dominance than Young. (Though Hewitt has racked up better ace totals.)

Surprisingly, it isn’t that lefties are bigger servers. On average, both lefties and righties win about 73% more service points than return points. The tentative conclusion I see from these numbers is that lefties–with the typical exception of Rafa–can’t get away with a weak serve the way that right-handers can.

Young’s SW/RW this week of 1.69 suggests that, despite only 13 aces in four matches, he’s playing well behind his serve, and the results have followed.  It may be, though, that a modest improvement to his serve–or perhaps his tactics behind the serve–would be particularly valuable, seizing whatever specific advantages worked for guys like Verdasco and Melzer.

If Young is (finally) to take a big step forward, he’ll need to do more with his serve for a season–not just a week. He doesn’t need to become the next Feliciano Lopez; he just needs to be a little less like a left-handed Fognini.

Bouchard, Radwanska, and Second Serve Futility

In yesterday’s women’s semifinals, we were treated to some impressive return-of-serve performances. Li Na won almost 65% of points on Eugenie Bouchard‘s serve–a higher percentage than she won on her own.

A less positive view of the situation is that we saw some dreadful serving performances. In particular, both Bouchard and Agnieska Radwanska struggled to win any points at all on their second serves. Genie won just 5 of 27 after missing her first serve, while Aga won only 2 of 16.

You don’t need an IBM Key to the Match to realize that those numbers aren’t going to cut it.

The WTA features a more return-oriented game and more breaks of serve than the ATP does, but these numbers are far out of the ordinary, especially for a solid server such as Bouchard. Here are some circuit-wide averages, derived from about 1,000 tour-level matches played last season:

  • WTA players win 55.5% of service points: 62.3% on first serves and 44.6% on second serves.
  • When the second serve lands in play–in other words, excluding double faults, players win 51.8% of second-serve points.
  • In the average losing performance, players won 57.1% of first-serve points, 40.0% of second-serve points, and 47.2% of second-serve points in play.

Then again, Li and Dominika Cibulkova–especially the Slovakian–aren’t average returners. In 16 Cibulkova wins for which I have serve statistics, she never failed to win at least half of second-serve return points. Only once did she win less than 58% of them, and her median performance was a whopping 63% of second-serve points won. In 7 of the 16 matches, she won second-serve return points at a higher rate than her own first-serve points.

Domi’s dismantling of Radwanska’s second serve still stands out, but in this context, it doesn’t look quite so unusual. When Cibulkova is hitting the ball well, you might as well be throwing batting practice once you miss your first offering.

While Li’s best return performances don’t quite stack up with Cibulkova’s, she has little trouble neutralizing her opponents in Melbourne. In six matches, she has won more than half of second-serve return points in every match, peaking with a 12-of-15 performance in the fourth round against Ekaterina Makarova. Overall, Li has won 86 of 136 second-serve return points in the tournament, good for 63%.

On Saturday, one of these powerful forces will have to give way to the other. The last time Li and Cibulkova met, in Toronto last summer, Domi had one of her worst serving performances of the year, winning only 35.5% of second-serve points, 44.0% of those that landed in play. In that match, Cibulkova failed to display the dominating return game that has been her trademark in Australia, winning barely half of Li’s second offerings, and only 41% when excluding double faults.

But as Cibulkova showed by crushing Radwanska for only the second time in six career meetings, her performances aren’t predictable. Her all-or-nothing style guarantees that we’ll see some fireworks in the final from both servers and returners. And at the rate she’s going, Domi might set some more records in the process.

For even more detailed analysis of yesterday’s semifinals, check out the charting-based analysis of Li-Bouchard and Radwanska-Cibulkova.

Novak Djokovic and Neutralizing the Second Serve

Italian translation at settesei.it

When Novak Djokovic stands on the other side of the court, you’d better make some first serves.

Djokovic is one of only two players this year to win more than 55% of second-serve-return points (David Ferrer is the other).  When you consider that he also wins more than 35% of first-serve-return points, it’s less clear that the server has much of an advantage.  In fact, when Novak is performing at that level, if his opponent goes through a bad patch and only makes a quarter of his first serves, Djokovic has a better than 50% chance of breaking serve.

Commentators often refer to Djokovic’s return as a weapon, and they’re not joking.  Only six players (including Novak himself and, invariably, John Isner) won as many second-serve points as Novak won second-serve-return points.

What’s most remarkable about his return game is how quickly he neutralizes the second serve, often using tactics that, in the hands of lesser mortals, would be more appropriate for service points.  Unlike other returners, he is somewhat more likely to win a short return point than a long one.  While other players need a few shots to negate the advantage conferred by serving, Djokovic is most effective early in service points.

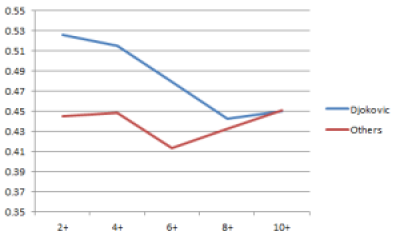
This graph shows the percentage of second-serve-return points won by Djokovic, by rally length, in four matches I’ve charted (US Open vs Stanislas Wawrinka and Rafael Nadal; Tour Finals vs Wawrinka and Juan Martin del Potro), compared to the the same percentage for other top-ten players (excluding Rafael Nadal) in 19 other matches I’ve charted from the US Open and Tour Finals this year:

novak1

When the return lands in play, Djokovic wins almost 53% of return points, while the pack manages less than 44%.  (All of these matches are between top-ten opponents, so the averages are much lower than season numbers, which are affected by matches against lesser opponents.)  The difference stays about the same when we take out 2- and 3-shot rallies.

When we limit our view to points that reach six shots, Novak still has a substantial edge, roughly 48% to 42%.  But in points longer than seven shots, there’s virtually no difference.

Djokovic’s return is so good that if his opponent misses his first serve, the point has turned into a Novak service point.  Opponents are forced to fight their way into their own service points!

This was particularly true in the Djokovic-Nadal US Open final.  (Follow the link, then click the ‘Serve Influence’ tab for a shot-by-shot winning percentage breakdown.)  Nadal won barely half of his second-serve points when Djokovic got his return in play, but once the rally reached five shots (or six, or seven, and so on), Nadal had the edge, winning 60% of points.  From the five-shot mark, Rafa’s advantage only increased.

Of course, Nadal won that match.  It’s not quite so useful to convert return points into service against an opponent whose own return of serve is so effective.  To win today, Novak needs to do more than just attack Rafa’s second serve.  He must either do so even more effectively than he did in New York, or put himself in a better position to win longer return points after the effect of his return has worn off.

Juan Martin del Potro and Return of Serve Gaps (+Updated WTForecast)

While Juan Martin del Potro isn’t known for his return of serve, it isn’t a major hole in his game.  This year, he has won 38.5% of return points, worse than most of the top 10, but better than Stanislas Wawrinka, Jo Wilfried Tsonga, and about 30 other members of the ATP top 50.

Where del Potro underwhelms is more specific.  Despite effectively returning second serves, he’s far worse than average against first serves.  In 2013, his 28.4% of first-serve-return points won ranked him 36th among the top 50, only 0.1% above Milos Raonic and far behind every other member of the top 10.  Yet Delpo is in the top ten when it comes to second-serve-return points.

Even for a big server like del Potro, it’s difficult to reach the top five without an effective return game.  While he breaks serve less often than any other World Tour Finals qualifier this year, he’s within a percentage point of Wawrinka, Tomas Berdych, and Roger Federer, so it’s clear that statistically, the Argentine is far from being a John Isner-style one-trick pony.

What sets him apart, then, is the enormous gap between first- and second-serve-return effectiveness.  To illustrate the difference, I calculated the ratio of second-serve-return points to first-serve-return points for all eight men in London this week, plus Andy Murray.  Delpo is third among all players with 40 or more tour-level matches this year, while the bottom five names on this list are all in the opposite third of ATP regulars.

Player                  v1W%   v2W%  v2/v1  
Juan Martin Del Potro  28.4%  53.4%   1.88  
Tomas Berdych          30.6%  54.6%   1.79  
Richard Gasquet        30.5%  54.2%   1.78  
Stanislas Wawrinka     30.7%  50.3%   1.64  
David Ferrer           34.5%  56.4%   1.63  
Andy Murray            33.7%  54.7%   1.62  
Roger Federer          32.9%  51.6%   1.57  
Novak Djokovic         35.5%  55.4%   1.56  
Rafael Nadal           35.0%  54.6%   1.56

An aspect–or perhaps a cause–of del Potro’s first-serve-return woes is his knack for letting aces sail by him.  In 2013, 10.5% of his opponents’ first serves were aces, more than any other member of the top 50.  Controlling for opponent serve quality (he did play Isner twice this year), he “improves” to third-worst, ahead of Dmitry Tursunov and Feliciano Lopez.  After this adjustment, we discover that Delpo allowed 22% more aces than an average player would have against the same set of opponents.

When aces are removed from the calculation, del Potro still stands out in comparison to other top players, but he is no longer quite so extreme.  His ratio of second-serve-return points won to first-serve-return points won ignoring aces is 1.55, just a bit higher than Berdych’s 1.53, Richard Gasquet‘s 1.52, and David Ferrer‘s 1.51.

If Delpo gets a racquet on the ball, then, he’s not that much less effective against first offerings than his London competitors.  But he doesn’t get his racquet on as many balls, and however we might manipulate the numbers for fun and profit, the Argentine doesn’t have the option to ignore aces.

So, how much does a poor first-serve return matter?  As with Murray’s infamous second serve, it’s tough to say.  In both cases, the weakness doesn’t keep its possessor from winning big matches against the game’s best, but it might be what is preventing him from ascending from the very top of the rankings.

Were del Potro to improve his first-serve return to the level of the next-worst London participant, Gasquet, it would mean a jump this year from 28.3% of first-serve-return points won to 30.5%.  That would bump up his overall return points won to just short of 40%, and improve his break percentage from its current middle-of-the-pack 23.8% to a nearly-top-ten 26.0%, in the neighborhood of Berdych and Federer.

An improvement of that nature would make Delpo a much bigger factor at the very top of the men’s game.  But like Murray’s second serve, it isn’t that easy.  There’s more than one route to the top–del Potro’s game isn’t so unbalanced to keep him from beating the best players in the world, so perhaps he could more easily improve, say, his second serve than his first-serve return.  It’s tough to tell from the sideline or, especially, the statsheet.

In the meantime, if you’re supporting del Potro tomorrow against Novak Djokovic, you might consider becoming one of those boorish fans that cheers every first-serve miss off of Novak’s racquet.  Lots of Djokovic second serves might be Delpo’s best path to victory.

London forecast: With Berdych’s win today, all eight players remain in contention.  A lot hinges on Friday’s match between Wawrinka and Ferrer, while we won’t gain much clarity on Group B until tomorrow.

Player     3-0  2-1  1-2  0-3       SF      F      W  
Nadal      70%  30%   0%   0%    98.4%  57.0%  34.1%  
Djokovic   42%  46%  11%   0%    88.3%  54.9%  30.9%  
Ferrer      0%   0%  54%  46%    14.8%   5.5%   2.0%  
Del Potro  22%  50%  28%   0%    71.6%  36.3%  16.4%  
Federer     0%  30%  51%  20%    29.9%  13.1%   5.9%  
Berdych     0%  30%  70%   0%    36.0%  12.4%   4.0%  
Wawrinka    0%  46%  54%   0%    50.9%  17.4%   5.6%  
Gasquet     0%  10%  44%  45%    10.1%   3.2%   1.0%

For the pre-tournament forecast, click here.

Berdych d. Ferrer: Click here for detailed serve, return, and shot-by-shot stats for today’s evening match.

Avoiding Double Faults When It Matters

Italian translation at settesei.it

The more gut-wrenching the moment, the more likely it is to stick in memory.  We easily recall our favorite player double-faulting away an important game; we quickly forget the double fault at 30-0 in the middle of the previous set.  Which one is more common? The mega-choke or the irrelevancy?

There are three main factors that contribute to double faults:

  1. Aggressiveness on second serve. Go for too much, you’ll hit more double faults.  Go for too little, your opponent will hit better returns.
  2. Weakness under pressure. If you miss this one, you lose the point. The bigger the point, the more pressure to deliver.
  3. Chance. No server is perfect, and every once in a while, a second serve will go wrong for no good reason.  (Also, wind shifts, distractions, broken strings, and so on.)

In this post, I’ll introduce a method to help us measure how much each of those factors influences double faults on the ATP tour. We’ll soon have some answers.

In-game volatility

At 30-40, there’s more at stake than at 0-0 or 30-0.  If you believe double faults are largely a function of server weakness under pressure, you would expect more double faults at 30-40 than at lower-pressure moments.  To properly address the question, we need to attach some numbers to the concepts of “high pressure” and “low pressure.”

That’s where volatility comes in.  It quantifies how much a point matters by considering several win probabilities.  An average server on the ATP tour starts a game with an 81.2% chance of holding serve.  If he wins the first point, his chances of winning the game increase to 89.4%. If he loses, the odds fall to 66.7%.  The volatility of that first point is defined as the difference between those two outcomes: 89.4% – 66.7% = 22.7%.

(Of course, any number of things can tweak the odds. A big server, a fast surface, or a crappy returner will increase the hold percentages. These are all averages.)

The least volatile point is 40-0, when the volatility is 3.1%. If the server wins, he wins the game (after which, his probability of winning the game is, well, 100%). If he loses, he falls to 40-15, where the heavy server bias of the men’s game means he still has a 96.9% chance of holding serve.

The most volatile point is 30-40 (or ad-out, which is logically equivalent), when the volatility is 76.0%.  If the server wins, he gets back to deuce, which is strongly in his favor. If he loses, he’s been broken.

Mixing in double faults

Using point-by-point data from 2012 Grand Slam tournaments, we can group double faults by game score.  At 40-0, the server double faulted 3.0% of points; at 30-0, 4.2%; at ad-out, 2.8%.

At any of the nine least volatile scores, servers double faulted 3.0% of points. At the nine most volatile scores, the rate was only 2.7%.

(At the end of this post, you can find more complete results.)

To be a little more sophisticated about it, we can measure the correlation between double-fault rate and volatility.  The relationship is obviously negative, with an r-squared of .367.  Given the relative rarity of double faults and the possibility that a player will simply lose concentration for a moment at any time, that’s a reasonably meaningful relationship.

And in fact, we can do better.  Scores like 30-0 and 40-0 are dominated by better servers, while weaker servers are more likely to end up at 30-40. To control for the slightly different populations, we can use “adjusted double faults” by estimating how many DFs we’d expect from these different populations.  For instance, we find that at 30-0, servers double fault 26.7% more than their season average, while at 30-40, they double fault 28.6% less than average.

Running the numbers with adjusted double fault rate instead of actual double faults, we get an r-squared of .444.  To a moderate extent, servers limit their double faults as the pressure builds against them.

More pressure on pressure

At any pivotal moment, one where a single point could decide the game, set, or match, servers double fault less than their seasonal average.  On break point, 19.1% less than average. With set point on their racket, 22.2% less. Facing set point, a whopping 45.2% less.

The numbers are equally dramatic on match point, though the limited sample means we can only read so much into them.  On match point, servers double faulted only 4 times in 296 opportunities (1.4%), while facing match point, they double faulted only 4 times in 191 chances (2.2%).

Better concentration or just backing off?

By now, it’s clear that double faults are less frequent on important points.  Idle psychologizing might lead us to conclude that players lose concentration on unimportant points, leading to double faults at 40-0. Or that they buckle down and focus on the big points.

While there is surely some truth in the psychologizing–after all, Ernests Gulbis is in our sample–it is more likely that players manage their double fault rates by changing their second-serve approach.  With a better than 9-in-10 chance of winning a game, why carefully spin it in when you can hit a flashy topspin gem into the corner?  At break point, there’s no thought of gems, just fighting on to play another point.

And here, the numbers back us up, at least a little bit.  If players are avoiding double faults by hitting more conservative second serves on important points, we would expect them to lose a few more second serve points when the serve lands in play.

It’s a weak relationship, but at least the data suggests that it points in the expected direction.  The correlation between in-game volatility and percentage of second serve points won is negative (r = -0.282, r-squared = 0.08).  Complicating the results may be the returner’s conservative approach on such points, when his initial goal is simply to keep the ball in play, as well.

Clearly, chance plays a substantial role in double faults, as we expected from the beginning.  It’s also clear that there’s more to it.  Some players do succumb to the pressure and double fault some of the time, but those moments represent the minority.  Servers demonstrate the ability to limit double faults, and do so as the importance of the point increases.

Continue reading Avoiding Double Faults When It Matters