Is Victoria Mboko a pusher? I was tagged in a Twitter exchange the other day debating that exact question. From watching her play, I would hardly compare her to Ostapenko, but the p-word wouldn’t have come to mind.
Rally Aggression Score puts her at +6, on a scale designed to run from -100 to +100. Based on 27 charted matches from the last 52 weeks, that makes her about neutral, tactically similar (at least along this dimension) to the likes of Belinda Bencic and Karolina Muchova. Counterpunchers, maybe, not pushers.
On the other hand, “neutral” overstates it. Lowell West devised the metric about a decade ago, and the game has changed since then. The way I initially scaled it, Petra Kvitova flirted with triple digits, and that was about it. Now, Dayana Yastremska gets close to 200. Elena Rybakina, at exactly 100 in the last year, ranks only fifth among players with at least five charted matches. There’s nothing so extreme at the other end: Emma Navarro has averaged -68, while the most passive top-tenners are Coco Gauff and Mirra Andreeva at -20 and -30, respectively.
Mboko’s +6, while hardly vintage Wilander, is indeed more passive than the average WTA player in 2026.
Aggressive growth
Will the Canadian change tactics with age? These days, it seems like nearly everyone at least tries to take more chances and hit more winners. (If you don’t, your opponent will!)
I can’t tell Mboko’s future, but I can load up a database and run queries on it.
So, different question: Do players in general change tactics with age? It’s easy to think of examples: Serena Williams got more aggressive over the years. Ostapenko (remarkably) has done the same. I’m not sure there are equally prominent players who have moved in the other direction, but it does seem like some teenagers show up bashing balls, then settle for a more measured game in their 20s.
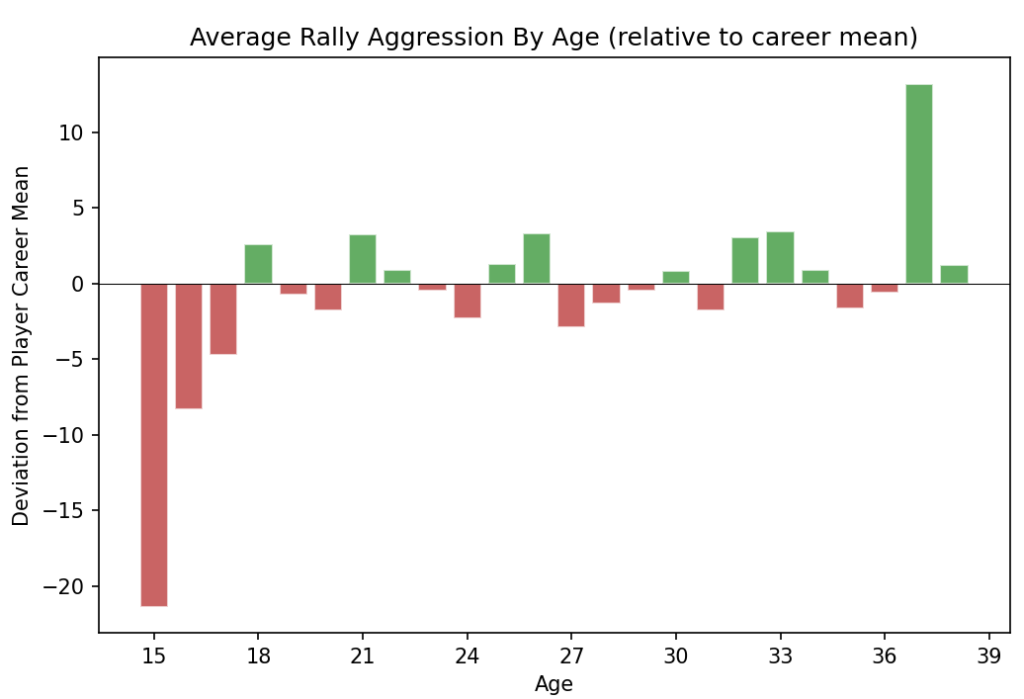
I took all women with at least 20 charted matches, grouped their rally scores by year, and figured out how much each year’s score differed from their career norms. Average those deviations across all players, and this is what you get:
From age 18 to 36–the entirety of most players’ careers–there’s nothing to see here. Plus or minus five points of rally aggression score is a rounding error, especially since these are non-random samples based on what Match Charting Project contributors wanted to chart and could find on video.
The spike at age 37 is also not very instructive: It’s basically Serena Williams, and we already knew that as she aged, she took increasingly few prisoners. From 2007 to 2009, her average aggression score was about +20. In 2019, when she was 37, it was +109.
Still, that climb at the left end of the graph is suggestive. It doesn’t literally apply to Mboko, who is already 19. But it supports a plausible narrative. When young women–especially the youngest prospects–arrive on tour, they aren’t as strong, or perhaps even as tall, as they will soon become. (Even Lilli Tagger recently gained a centimeter.) Their experience is disproportionately against juniors, who are even less physically imposing, relative to adult pros. The typical 16-year-old, no matter how talented, isn’t going to show up on tour and play like Sabalenka.
There are exceptions, of course. Maria Sharapova’s highest single-season aggression score was in 2004, when she was 17. Madison Keys arrived on the circuit playing essentially the same game she would play for the next decade. Iga Swiatek was more aggressive at age 18 than she has been since.
On average, though, the youngest players are more conservative–fewer winners, fewer errors–than they will become as they graduate from their teens. The mechanism could well apply to a 19-year-old, too.
The trend is null
We’re always talking about how players could develop and improve, or what their new coach brings to the table. Yet the undefeated champion of tennis forecasting is the null hypothesis. The null hypothesis, of course, means that you should’ve skipped this entire post and watched a Friends rerun instead.
It is boring, but the best way to predict how a player will look next year is to point at their current results and say, “yeah, just like that.” You can fiddle around the edges and maybe find players on the cusp of something or other, but … no, usually you can’t even do that.
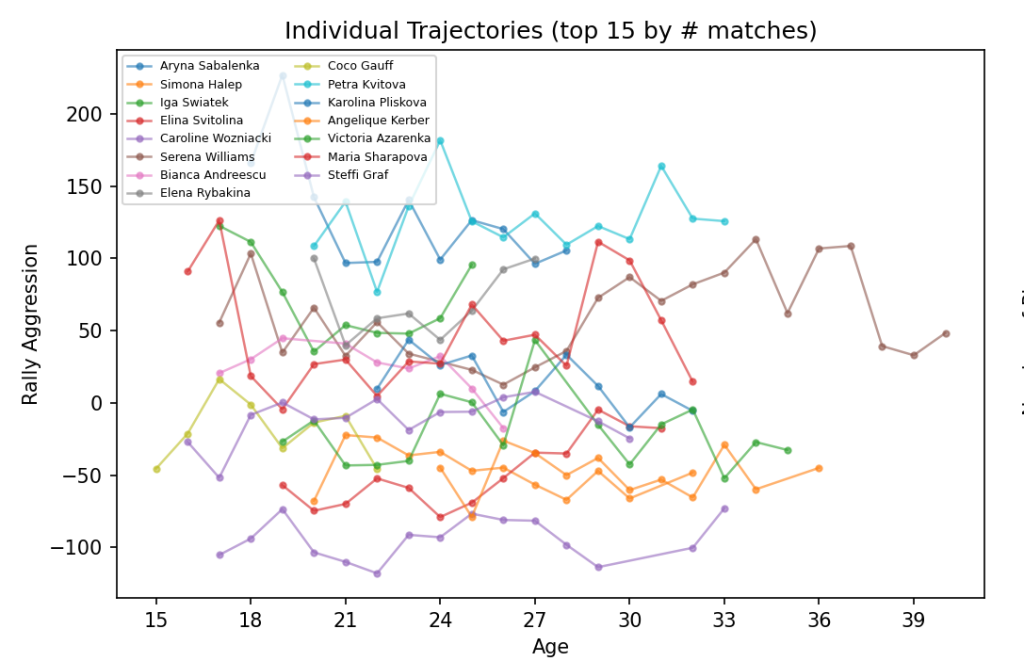
Here are the year-to-year aggression trends of the women with the most matches in the MCP database:
See that trendline that goes from the lower-left corner up to the upper-right? No, you don’t, because it’s not there. The closest is Serena, who dipped to +12 in her late 20s before getting hyper-aggressive in her 30s.
To answer the question posed by my headline, then: No, pushers don’t grow out of it. The style of play you see today is a good predictor of the style of play you’ll see a decade from now.
Lucky for Mboko, then, that she isn’t a pusher. Throughout her career, I’ll bet she tries a lot of new things and incorporates plenty of fresh ideas from a handful of high-profile coaches. The end result may well take her to the top of the rankings: A 19-year-old ranked 6th on the Elo table has a bright future ahead. If she finds a game that takes her all the way to the top, odds are it will look a lot like what we’ve seen so far.
Felix Auger-Aliassime has earned a reputation as a world-beater on indoor hard courts. He’s no Jannik Sinner–as Sinner reminded him all four times they met last year, twice indoors–but FAA is a fearsome customer against just about anybody else.
Last week the Canadian added to his indoor title haul with his second-straight championship in Montpellier. This time, he straight-setted Adrian Mannarino. While that win doesn’t particularly raise any eyebrows, the body of work keeps growing. It’s his eighth career title indoors, three of them at ATP 500s. Last fall in Paris, he also reached his second Masters final. (The first was in Madrid, the indoorsiest of the clay Masters.)
What’s the secret?
The conventional wisdom is that he has a big game, especially a deadly first serve. The controlled environment indoors, plus typically fast conditions, play to his strengths. The serves skid across the court even faster. His weaknesses are mitigated because the bounce is more predictable and because points are shorter.
All that sounds plausible. My only gripe is, couldn’t you say that about a lot of players? The whole paragraph applies, almost word for word, to Hubert Hurkacz, who has two Masters crowns on outdoor hard, plus a clay title, yet just a pair of indoor 250-level championships. What about Matteo Berrettini? The description might match him even better, yet the Italian has never won a title indoors. He has reached only one indoor 250-level final.
Before we go to the numbers, let me give you my seat-of-the-pants theory. FAA has huge weapons, but he doesn’t always play like it. He doesn’t consistently swat away easy plus-ones like Berrettini does. He gets sucked into long rallies, where he’s often at the disadvantage. Indoors, though, he knows what the tactics are, and he plays the way he should play. Indoor Felix, then, is the best Felix, both because his game is suited to the conditions and because he shows up with the right approach.
On the other hand, the last two points against Mannarino on Sunday were 8- and 18-shot rallies, respectively. So, you know, don’t trust my pants.
Numbers!
You can, however, trust the spreadsheets. The Match Charting Project has well over 100 Auger-Aliassime matches. Going back to 2020, the total includes 41 on indoor hard and 40 on outdoor hard, nicely suited for some comparisons. I was tempted to throw out the seven Tour Finals matches from the indoor tallies, because they skew the quality of the opponents, but the Canadian’s indoor averages are about the same with or without them.
Surface       Unret%  <=3 W%  RiP W%
Indoor Hard    35.7%   47.7%   55.5%
Outdoor Hard   32.8%   43.4%   49.7%
About three percentage points more serves don't come back, and there's an even wider gap in points polished off on the serve or plus-one (the "<=3 W%" stat). The biggest gap here is in points won when the return comes back. Sub-50% is below average, especially for hard courts. 55% or better is very good, even in fast conditions.
Almost all of the indoor/outdoor serve differences are thanks to the first serve. FAA's second-serve numbers are about the same regardless of roof status.
Of course, Felix isn't the only guy on tour who wins more easy serve points indoors. I don't have comprehensive stats on the indoor/outdoor split, so I can't tell you the exact tour average. But we can compare how much Auger-Aliassime gains on serve to how much he gives up on return:
Surface        RiP%  RiP W%
Indoor Hard   65.3%   48.8%
Outdoor Hard  67.5%   43.2%
He retrieves 2.2 percentage points fewer serves indoors--better than the 2.9-percentage-point difference he gains on serve. But when he gets the serve back, he's actually better indoors than outdoors! He gains five percentage points in that department on serve, and he gains the same margin on return.
This might dovetail with the conventional wisdom. His monster serve really pays off indoors. And predictable conditions give him a bit of cover on return.
Whatever the reason, Auger-Aliassime's groundstrokes are way more effective indoors. My Potency metrics, FHP and BHP, combine winners, unforced errors, and shots that set up winners and errors. They give you one-number estimates of how valuable each shot is, and... wow:
Surface       RallyLen  FHP/100  BHP/100
Indoor Hard        3.7     +8.5     +0.0
Outdoor Hard       3.9     +3.2     -5.8
His indoor points are a little shorter, but I assume that is typical. I would've guessed that the difference was greater.
The Potency numbers (expressed here as rates per 100 shots), tell a more emphatic story. A +3.2 FHP/100 is ok, not great. Tommy Paul and Ugo Humbert are in that zone. On the other hand, +8.5 is the 52-week average of Carlos Alcaraz. A -5.8 BHP/100 is near the bottom of the pack, below the likes of Ben Shelton and Grigor Dimitrov. By contrast, +0.0 is, as it sounds, a good solid average.
These numbers don't drill into the "why" questions that naturally follow. But they help us pick between theories. I suspect that much of the difference in groundstroke stats has to do with the shots he gets to hit. The winners are downstream of good serves. Auger-Aliassime picks up some aces, but he picks up more plus-one (or even plus-two) winners, and those make his forehand and backhand numbers look good.
The "indoor predictability" thesis also looks good here. Remember that everybody should benefit from that--and not everybody's numbers improve like Felix's do--but it may be that the Canadian is more-than-typically exposed by the vagaries of outdoor play.
All the angles
Quick thought experiment. Picture Roger Federer hitting an ace.
Now imagine Auger-Aliassime hitting an ace.
What specific serves came to mind? If you're like me, you pictured Federer shooting a bullet right down the tee. And then you visualized FAA hitting a flat bomb out wide.
Of course, both guys hit plenty of aces in every direction. The charting stats suggest that Felix has a slightly better chance of an ace when he goes up the middle. (Federer did too, by a bigger margin, as do most players.) Still, this indoor/outdoor split caught my eye:
Surface       Deuce Wide%  Ad Wide%  BP Wide%
Indoor Hard         50.5%     47.8%     33.7%
Outdoor Hard        46.9%     45.2%     41.0%
Each column shows how often Auger-Aliassime opted for a wide serve in various scenarios. The first-serve differences are probably more marked, because his second-serve tendencies are about the same.
Indoor, he goes wide more often--but less often under the pressure of break point. While the margins are rather slim, it seems like the wide serve becomes his bread-and-butter indoors, and he uses the tee serve to mix things up on break point--because he's hitting more wide serves the rest of the time.
Wide serves are more likely to come back, but they don't make the returner any more likely to win the point. Especially against Felix: His signature serve might not even be an ace, but a wide bomb that the returner just barely plops back over the net.
The fact that he hits more wide serves indoors explains a lot. He gets a few more unreturned serves (as everybody does, probably), but he gains more of an advantage on the serves that (weakly, oh so weakly) come back. His groundstroke stats sparkle, padded by those easy balls.
Here's one final comparison:
Surface       2ndAgg
Indoor Hard       +7
Outdoor Hard     +46
"2ndAgg" is the Aggression Score stat tailored specifically to second serves. A higher score means more double faults and more unreturned second serves. Lower means fewer risks on second balls. +7 is quite conservative: Only about a dozen players consistently score so low.
But--those careful second servers include Sinner, Hurkacz, and Berrettini. With a game like Auger-Aliassime's, the second serve isn't the time to take risks. And indeed, in all of his indoor finals, he has never topped a double-fault rate of 5%. In the Montpellier final, he missed his second serve just once, and he committed no double faults at all in the quarter- and semi-finals.
Here, finally, is some support of my seat-of-the-pants theory, that when Felix goes indoors, he plays the way he ought to be playing all the time. He stays within himself, which is still imposing enough to earn a lot of cheap points. It's not a particularly complicated story, and I'm still not convinced why it doesn't apply to a half-dozen other guys on tour. Maybe it is all about the wide serve, the signature shot that allows Auger-Aliassime to manage risk and put his opponents on the back foot, all at the same time.
On Saturday, 20-year Sara Bejlek won her biggest title–by far. She had just slipped out of the top 100, so after qualifying for the main draw in Abu Dhabi, she charged past the likes of Jelena Ostapenko and Clara Tauson, then secured the trophy with a 7-6, 6-1 win over almost-top-tenner Ekaterina Alexandrova.
It’s tough to overstate just how out of the blue this was for the Czech. By ranking, Ostapenko, Tauson, and Alexandrova represent three of her four highest-ranked victories. Her two other main-draw victims, Sonay Kartal and Ashlyn Krueger, also count among her top ten. And she beat Kartal 6-0, 6-2.
That’s a big-hitting set of opponents. Bejlek, by contrast, lacks the power weapons that are becoming standard on the WTA tour. As a left-hander, she practically begs us to call her “crafty.” One upset against that group is plausible enough: After all, Ostapenko’s low-percentage tennis invites chalk-defying outcomes. But so many?
The final
I don’t pretend to be an expert on the Czech’s game. She has only a couple dozen tour-level matches under her belt, so she’s a newcomer for most of us. That said, we now have a detailed match chart from Saturday’s final that offers some clues as to how Bejlek battled the barrage of ball-bashers in Bahrain Abu Dhabi.
The conditions helped. It was windy, and the conditions were slow. None of that favored Alexandrova, who likes predictable balls she can smack flat back across the net. The court speed not only made it difficult for Alexandrova to hit through the court, it gave her a little less pace to work with on Bejlek’s own balls. Surely the Russian must have wished she had played indoors in Ostrava(!!!) instead.
The lefty’s game plan seized on those advantages. She looped balls back down the middle. She sliced more than she had to, refusing to give her opponent a predictable bounce height. She mixed in some almost impossibly slow serves. She won the first point of the match with a dropshot-lob combo that, while she didn’t attempt many more, surely gave Alexandrova pause.
The central result was that the Russian just couldn’t hit winners. By my count, she ended with 13 winners against 37 unforced errors. Just as telling as the abysmal ratio was that the 13 winners represented less than 10% of total points. In her last 60 charted matches–going back to 2022–opponents have held her under 10% just six times. When they do, it’s usually because they take the racket out of her hands by playing hyper-aggressively themselves. Two of the opponents in question were Anisimova and Yastremska.
Bejlek, by contrast, gave Alexandrova ball after ball that looked like it should have been obliterated. In different conditions, or when the Russian was in better form, maybe the winner count would have been much higher. But from the first few games, it was clear that the Russian wasn’t confident in her ability to take control. Big, aggressive hitters usually have more influence on rally length than more passive opponents, but that wasn’t what happened on Saturday. The average point lasted 5.1 strokes, tied for third-longest among the nearly 100 charts we have from Alexandrova’s career.
Translated into tennis cliché: Bejlek let her opponent beat herself.
If we can extract one concrete skill from the Abu Dhabi final, it’s that Bejlek doesn’t let servers overpower her. 85% of Alexandrova’s serves came back, compared to a 52-week average of 75%. Again, we don’t have much data yet on Bejlek, but here’s another bit of evidence: In Madrid two years ago, she retrieved more than 80% of Rybakina’s serves. The Aussie Open champ is the toughest on tour to return, usually holding opponents to around 67%.
Despite all the frustrations and all the extra shots she had to hit, Alexandrova nearly pulled out the first-set tiebreak. She led 4-2 at the change of ends before getting dragged into a series of long rallies broken up only by a couple of well-executed short points from the Czech. Having dropped the 95-point slog that was the first frame, Alexandrova ran out of ideas. She simply watched the error count soar.
You don’t win slams by letting opponents beat themselves–marathon runners notwithstanding. But in the hands of someone persistent enough, it’s a game plan that can keep you in Bejlek’s new neighborhood of the top 40. With 500 points on the books from Abu Dhabi, the left-hander has the rest of the season to prove that she belongs.
It often feels fruitless to pick out the strongest aspects of the Carlos Alcaraz game. (Sinner’s, too, of course.) He is so good at everything that we tend to focus on the same few particularly attention-grabbing attributes. The knee-buckling dropshot, the outrageous will to win (and corresponding fifth-set record), the forehands at full stretch.
We don’t ask often enough why Alcaraz or Sinner won a match, because it seems obvious. They’re simply better than everybody else, except for maybe Novak Djokovic or Cameron Norrie on a good day.
And it’s true, there’s no single reason why. (There’s never a single reason for anybody, though most players make it easier to isolate a small number of effective shots or tactics.) All we can do is focus on one part of the Alcaraz game, then goggle at it.
Today, let’s goggle at the return of serve.
Here’s a fun place to start. Djokovic completed five matches at the Australian Open. Take a look at his first-serve win percentages from those five matches:
Opponent           1st W%
Martinez            93.2%
Maestrelli          86.0%
van de Zandschulp   77.0%
Sinner              71.4%
Alcaraz             65.9%
Djokovic, at any age, is an outstanding hard-court server. 71.4% is below average: Sinner did a nice job on return, even if he forgot on some break points. 65.9%, though, is unreal. Of the ATP top 50, how many players do you think win fewer than 66% of their first-serve points? One: Sebastian Baez. Alcaraz turned Djokovic into Sebastian Baez.
It wasn’t a fluke, either. Djokovic won 66.1% of first-serve points against Alcaraz in the US Open semi-final last year. Those two aren’t the absolute worst serving performances of Djokovic’s last twelve months–Vacherot held him to 60.5% in Shanghai, and Musetti kept him to 61% in their abbreviated match–but they are close.
Two separate skills
Charting data allows us to break down service returns into two components:
Getting serves back
Winning points after getting the serve back
Pretty straightforward stuff. You want to get as many serves back as possible, but you also want to set yourself up to win points after you do.
There’s something of a tradeoff here. Jaume Munar is a good example of somebody who retrieves a ton of serves but loses a lot of the points because he doesn’t do enough with the return. Andrey Rublev is the opposite, not getting many returns back, but winning a relatively high percentage when he does. Adjusting for surfaces and opponent quality, the end result for Munar and Rublev is about the same, even if they get there via such different routes.
The tradeoffs don’t apply to everyone. Take a look at the scatterplot, which shows percentage of returns in play, and in-play return-points won, for all ATPers with at least ten charted matches in the last 52 weeks. The higher you are above the green regression line, the better. You can mouse over each dot for player details, but I don’t need to tell you whose dots are red:
Both halves of Sincaraz get more returns back than average, and they win more of those in-play points than anybody else.
(How they win the in-play points is itself a multifaceted question. Both Sinner and Alcaraz rank in the top six by my forehand and backhand potency metrics, and Alcaraz’s backhand rating continues to creep upwards. I also dug into their shot tolerance last year and found new statistical categories for them to lead.)
Remember I started out by talking about first-serve returns. That’s where Alcaraz really shines, even above his brother in world domination. Same idea, first-serve returns only:
Alcaraz is the right-most red dot. There are 36 players on that plot, and Alcaraz gets more first serves back than all but four of them. (And he’s basically tied with Medvedev, the blue dot underneath his.) There’s no tradeoff for Carlitos: He gets more balls back than almost anybody, and he wins more of those points than anybody except for Arthur Fils (barely), Sinner (barely), and Rublev (whack!).
Both skills were on display in Sunday’s final. Alcaraz put an astonishing 76.5% of Djokovic’s first serves in play–almost off the right side of the scatterplot, against an elite opponent, on a hard court. I say “astonishing,” but was it even a surprise? At the US Open, Alcaraz got 75% of Novak’s first serves back.
When you can handle so many first serves, the win rate barely matters, but of course Carlitos did fine in that department as well, winning 44.6% of those in-play returns in Melbourne. Lower than his usual rate by a healthy margin, but hey, it was still Djokovic, and a massive number of in-play returns is always going to include a fair few weak ones.
When I started looking at returns in play about a decade ago, the tradeoff was clearer. More players fit the Munar or Rublev molds, getting a lot of serves back, or winning a high percentage of points when they did–but not both. Now, the relationship between the two stats is positive, but only slightly. They’re best understood as unrelated.
But for Alcaraz, tennis is built out of a dozen or so unrelated skills–all of which allow him to tower over the field. Sinner is close enough, and his serve might tilt the scale slightly in the other direction. Everybody else, though, is left scratching their collective head. Djokovic became the greatest of his generation by taking away opponents’ second serves. When Alcaraz neutralizes your first, what’s left?
In Saturday’s Australian Open final, Elena Rybakina won 92 points. Aryna Sabalenka won 92 points. Rybakina won 76% of her first serve points; Sabalenka won 75%. Both players held on to 48% of their seconds. Even their average first serve speeds were nearly identical, Rybakina’s 178 km/h nipping Sabalenka’s 177 km/h.
Only a few moments really mattered. Sabalenka converted two of eight break points. Rybakina converted three of six.
With such narrow margins, we should be cautious to draw conclusions about tactics and player skills. Flip one or two of those break opportunities, and it would have been a very different trophy ceremony. Anybody who tries to tell you “why” Rybakina won should keep that in mind. Still, Sabalenka would surely like to know how to secure another half-dozen points and put the result out of the range of luck. Rybakina will hope to do the same.
Pick target, hit target
Rybakina is the best server in the women’s game. Her ace rate over the last year is better than 10%–a percentage point ahead of second place (Osaka), and miles ahead of Sabalenka’s 6%. Rybakina has won nearly 75% of her first-serve points, while no one else cracks 73% and only a few players are on the north side of 70%.
At key moments on Saturday, Rybakina dazzled with her ad-court serves out wide. She saved the only two break points she faced in the first set with back-to-back unreturned serves, both wide. She finished the match with another signature delivery, acing Sabalenka out wide on match point.
If you’re looking for a “why,” it’s tempting to focus on those wide ad-court serves. Rybakina made 18 first serves when she aimed for that corner, and she won 14 of those points.
But! It’s not the ad-wide corner, specifically. Rybakina was even deadlier when she targeted Sabalenka’s backhand corner in the deuce court. She landed 14 of those first serves, winning 13.
Here’s the Rybakina method for defeating the world number one:
Have a world-class serve
Aim first serves at the backhand corner
Make half of them
Easy, right?
Apparently not easy
Fair enough, most players don’t have anything like Rybakina’s serve. A few–Osaka, Noskova, Qinwen–can do a decent impression on a good day. Still, it’s an uphill battle to knock off Sabalenka with aggression from the line.
What’s striking, though, is that most opponents don’t really try.
Across 120+ charted matches since the beginning of 2024, Sabalenka’s opponents aimed their first serve at her backhand corner about 40% of the time. (That doesn’t mean they aimed 60% at the forehand corner: A fair number of first serves don’t land close to either corner.) In the vast majority of matches, her opponent aimed half or fewer of their first serves at her backhand corner.
On Saturday, Rybakina targeted the backhand corner 63% of the time.
The first serves that landed in were so devastating in part because she took a low-margin approach. Rybakina already misses more first serves than almost anyone on tour: Her 57.4% first-serve-in rate is worse than 45 of the top 50 women. Against Sabalenka, she succeeded exactly half the time when she fired in that direction. Corner-aimed serves are (unsurprisingly) lower-percentage for everybody, but her 50% was even worse than tour average.
It’s a smart tradeoff. Combine the two numbers, and we see that on 32% of her service points, Rybakina put a first serve in play to Sabalenka’s backhand corner. Those, as we’ve seen, are as close to guaranteed points won as you can find. Sure, that leaves 68% of service points to worry about. Yet as much as Rybakina’s premier weapon glitters, she’s a solid average at everything else. She’ll pick up a lot of those other points with quality second serves or rocket-powered firsts to the forehand corner, or by winning baseline rallies.
In the past two years, only a handful of players have managed to put first serves to Sabalenka’s backhand corner on as many as 32% of points. Even then, it doesn’t always work: Marketa Vondrousova, for instance, is unparalleled at hitting her targets, but her deliveries are softballs in comparison. For the players who can serve big, though, Rybakina may have pointed the way to tougher challenges against the world number one.
Ka-zam
This might be a recent refinement to Rybakina’s match tactics. We have over 80 charted matches for her since the beginning of 2024, and she has rarely aimed so many of her serves at the backhand corner. To be clear, she doesn’t need to. She straight-setted Sabalenka for the year-end title in November with only 44% of first serves pointed at that target.
But suggestively, Rybakina hit nearly as many first serves to the backhand corner in her Australian Open quarter-final match against Iga Swiatek. While she wasn’t quite as successful, landing just 40% of those attempts, the end result was encouraging. Even with all the misses, backhand-corner firsts accounted for a quarter of her service points. And she was as eye-poppingly successful on those points against Iga as she was in the final. Swiatek salvaged just 1 of 12.
It remains to be seen whether this is repeatable. When Rybakina is serving at her best, peppering the backhand corner is probably a good way to take advantage. (Unsurprisingly, since this is something tennis coaches tell twelve-year-olds.) If she’s misfiring, low-percentage first serves are probably not the way to fight her way through.
And surely, the world number one will start taking a few more backhand-return reps. She doesn’t have to turn into Andre Agassi to negate Rybakina’s new-found advantage. She just needs to defend that corner a little better. 94 or 95 points would have gotten the job done on Saturday. Even against a world-class serve and superb tactical execution, Sabalenka won 92. The two women will continue jostling for an edge, and it looks like the battle will increasingly take place with Sabalenka leaning to her left.
This post is dedicated to the memory of Damian Kust, tennis journalist and honorary Challenger warrior. He died this month at the age of 26.
Whatever it is that makes the Challenger tour compelling, it isn’t just the rising stars. Sure, when a Sinner or a Fonseca tears through the ranks, we tune in. Challenger-level competition is a litmus test, and we want to know whether the buzz is justified. But tomorrow’s all-world stars are just passing through. Fonseca played all of 56 matches at the level, and he’s already top-30. Sinner played 42. Federer played one.
If you’re the sort of person who is attracted to Challenger-level tennis, I suspect that the struggle is part of the appeal. Three-hour marathons, qualifying cuts, third-set cramps, tough losses to teenagers and aging veterans alike. We’re drawn to the sort of player who slogs away on Court 2 long after the rising-star top seed advances on Center.
Maybe this is something that can’t be quantified. But hey, what am I here for if not to stick numbers where they don’t belong?
Hence, the Challenger Warrior Index.
Challenger warriors are the guys who win matches the hard way. (If they could do it the easy way, I’m sure they would, but then they’d be playing bigger events.) The trick, when it comes to ranking “warrior-ness,” is to balance winning with fighting. The Index gives credit for victories and ranking improvements, yet it also boosts players for showing up often, especially when they push their opponents to the brink.
Here’s how it works. For the entire previous season, players get points for each of the following at Challengers and slam qualifying:
3 points per match, plus 2 points for each match win;
2 additional points for a three-setter, another 2 points if they win it;
1 point for each tiebreak, an extra two points if it’s a deciding TB, a bonus three points if they win it;
2 extra points per match that hits the three-hour mark;
5 points for reaching a final, another 5 points per title;
1 point per ranking place gained over the season, up to a maximum of 100;
20 point bonus for a year-end ranking inside the top 100 (AO main draw!)
The various 3-set bonuses are doubled for five-set matches in slam qualifying.
I don’t claim that this is the final word: I tinkered, and I’m making it up as I go along. Like I said, this isn’t the sort of thing that is meant to be quantified. Your personal Index would probably weight things differently.
2025 warriors
Here are the official, indefatigable warriors of the 2025 Challenger tour:
CWI  Player                    Matches  Titles  Rkg Gain
588  Francesco Maestrelli           72       3       103
586  Eliot Spizzirri                65       2       139
560  Emilio Nava                    67       4       124
542  Liam Draxl                     66       1       114
539  Joao Lucas Reis Da Silva       77       1       194
520  Roman Andres Burruchaga        71       3        51
519  Ignacio Buse                   64       2       132
516  Marco Cecchinato               72       1       147
510  Viktor Durasovic               58       1       176
509  Juan Carlos Prado Angelo       70       1        78
Maestrelli and Spizzirri come out in a near tie. Fittingly, the Italian triumphs by virtue of playing a few more matches.
The points-weighting, however arbitrary, works out nicely, rewarding differently playing styles and surface preferences. Everyone near the top of the list enjoyed a significant ranking boost over the course of the year, partly because of the points it earns, and partly because ranking boosts tends to go hand-in-hand with playing and winning a lot of Challenger matches.
As if on cue, Maestrelli is delivering on his warrior status this week, with two victories so far in Melbourne qualies. Even more appropriately, Draxl has done the same, thanks to a third-set tiebreak victory over Vitaliy Sachko to finish today’s session.
Here is the CWI roll of honor, going back another decade:
Year  CWI  Player                   Matches  Titles  Rkg Gain
2024  587  Tristan Boyer                 71       3       135
2023  589  Facundo Diaz Acosta           66       4        96
2022  603  Matteo Arnaldi                80       1       229
2021  634  Benjamin Bonzi                69       6       101
2020  357  Aslan Karatsev                38       2       177
2019  583  James Duckworth               71       4       134
2018  601  Cristian Garin                71       3       227
2017  660  Blaz Kavcic                   75       2       120
2016  590  Gerald Melzer                 66       4        98
2015  632  Daniel Munoz De La Nava       70       3       131
Arnaldi’s 80-match campaign was an impressive effort, the last one to merit a Warrior Index over 600. But the overall champion is Blaz Kavcic. In 2017, he played a whopping 32 three-setters, winning an even more eye-popping 25 of them. Five of the third sets went to a tiebreak, and he won them all. While none of those matches crossed the three-hour mark (Marco Cecchinato was the 2017 champ in that category), there’s no doubt that Kavcic showed up ready for battle, all year long.
There are more ways to measure Challenger success than future fame and fortune. I hope the Warrior Index points at some of the reasons these players deserve our admiration, no matter what their career peak ranking turns out to be.
The replies are fascinating. Responses run the gamut from “Why doesn’t everybody do this?” to “Switching grips will kill him.” Or my favorite: “What if he needs to hit a backhand?”
So we’re agreed: It could be the future of tennis, or it could be nothing. It isn’t completely unprecedented: Cheong-Eui Kim cracked the top 300 a decade ago, and a handful of juniors have reached an international standard for their age groups. Going way back, Beverly Baker Fleitz (#128 on my Tennis 128) took her two forehands all the way to the 1955 Wimbledon final. John Bromwich, another Wimbledon finalist, hit forehands and backhands from both sides.
And, of course, there’s a long history of teaching kids to hit forehands with their non-dominant hand. Rafael Nadal is a natural righty, while all-timers Maureen Connolly, Margaret Court, and Ken Rosewall were lefties who played right-handed. There’s no reason why any of those players couldn’t have developed two forehands instead of the one they did.
Let’s try to put some numbers on this. What’s the value of having two forehands instead of one?
Plug and play
We can’t run the counterfactual where, say, Carlos Alcaraz learns two forehands from age six. But we can work out what would happen if his backhand were exactly as effective as his forehand.
I probably don’t need to tell you that this would be an improvement for most players. We have ten-plus matches’ worth of 2025 charting-level data for 37 different men. Going by my Forehand Potency (FHP) and Backhand Potency (BHP) metrics, only three guys–Alejandro Davidovich Fokina, Daniil Medvedev, and Alexander Zverev–were more effective on the backhand side. Everybody else would’ve benefited from magically attaining forehand-level performance on both wings.
FHP and BHP tally up winners (plus forced errors), unforced errors, and shots that lead to one of those outcomes. Jannik Sinner, for instance, scores +13.2 FHP per match. Divide by 1.5 to translate to points, and Sinner’s forehand earned him about nine points per match more than a “neutral” forehand–one more like Zverev’s.
The typical tour regular grades out at 6.7 FHP and 0.6 BHP per match. That’s a difference of about six, or roughly four points. Put another way: Give the average player a backhand as effective as his forehand, and he’d win four more points per match.
Plus or minus
Four points per match. The average match runs about 140 points, so that’s a boost of nearly 3% of total points. Can you feel something dripping on you? That’s a tennis player uncontrollably salivating.
Three percentage points is huge. I once estimated that an improvement of one point in a thousand (0.1%, or one-thirtieth of 3%) was worth a single position in the rankings. That model wasn’t really designed to handle such big adjustments, so we can’t exactly say that a second forehand would be worth a 30-place ranking boost. On the other hand: Give, say, Tommy Paul four more points per match, and his point-winning rate would be as high as anyone except for Sinner. Hand the same boost to 49th-ranked Jenson Brooksby, and he’d win more points than anyone ranked outside the top six.
But. BUT. So many buts.
I don’t know about Herrera Sanchez, but I suspect that most two-forehanded players still have a weak side. Maybe the gap wouldn’t be as big as the standard forehand/backhand difference. But even with training from a young age, I doubt that the average unnatural-side forehand would be as strong as the player’s natural side forehand. I have no idea what that means for the 3% number, other than the fact that it is too high.
There’s also the issue of grip-changing. Depending on who you ask, the delay and awkwardness of switching from one forehand grip to the other either dooms the whole project, or it isn’t that big of a deal. I suspect that if a kid can learn to hit two forehands, he can figure out the grip-changing issues. Still, there is a probably a cost. (If nothing else, on return of serve. It might make sense to have a defensive backhand for first-serve returns only.) Again, I have no idea what that cost is. You give up a few more winners, but you hit better shots when you get there.
On the otherother hand, simply plugging in forehand value for backhand value might in one regard understate the benefits of having two forehands! 53% of ATP groundstrokes are forehands, yet most players target their opponents’ backhands. In other words, pros are covering considerably more than half the court with their forehand. There’s a cost to that: Awkward inside-out attempts, suboptimal court position after the shot, etc. Depending on the player, I’d guess that 10% to 20% of forehands would be backhands if the forehand weren’t the better option. (For example, only 45% of Medvedev’s groundstrokes are forehands.)
The better a player’s secondary shot, whether a backhand or a weaker-hand forehand, the less often he’ll go out of position to hit a forehand. Those are some of the toughest forehands, so taking fewer of them will mean (dominant-hand) forehand potency will go up, too. As with the other complications, I have no idea how to quantify that with the data we have. It’s probably not a significant change to the number, but directionally, it mitigates some of the effect of second-forehand weakness and grip-changing.
Stepping back
While I can calculate the hypotheticals, this is ultimately a coaching and player-development question. Given a talented, motivated youngster, is it worth teaching them a second forehand instead of a backhand?
Here, I really have no clue. Maybe Herrera Sanchez will make it big. The same level of early tinkering certainly worked out for Rafa! But how often have coaches tried this? For every Rafa or Rosewall, are there ten kids who flamed out (or just gave up) early because a weaker-hand forehand was too frustrating? Or did they end up starting late with a proper backhand, never fully developing that shot? How many youngsters even have the potential to develop a powerful forehand with their non-dominant hand?
It’s hardly a magic bullet, even if a junior does manage to develop high-quality shots on both wings. While 3% of total points is huge by tennis standards, you still need 50% to win most matches. If an up-and-comer with two forehands tops out at 5-foot-9, or struggles too much with double faults, or doesn’t develop elite movement and anticipation, or comes up short on any one of a hundred more dimensions, he’ll have a hard time establishing himself on the Challenger tour, if that. “Not good enough” plus 3% is still, almost always, not good enough.
The best way to think about this, I think, is to frame the second forehand as a really, really good backhand. It isn’t exactly the same, but it’s close enough. Novak Djokovic has one, and of course it has worked out for him, because he’s historically great at all sorts of things. Benoit Paire had one: He won three titles and made an appearance inside the top 20. Elmer Møller has one, and at age 22 he’s still hunting for a top-100 debut. A non-dominant-side groundstroke of that caliber is an incredible asset, yet it’s still a small part of a winning formula.
Is developing a second forehand easier than doubling up on backhand-down-the-line drills? Are there more kids out there who could crush it with their non-dominant hand than could develop an absolute top-tier backhand? I don’t know! If Herrera Sanchez (or someone else) makes enough waves, more coaches will consider the possibilities. Then we’ll get more data, and we might be able to sort out whether two forehands is a blind alley, or if it really is the future of tennis.
Here are just a few milestones we’ve hit recently:
17,000 charted matches
10,000,000 (yes, ten million) charted shots
1,000 different women with at least one charted match (we reached the same number of men last year)
2025 was the most productive year yet for the project. For the second year running, we added more than 2,000 matches. More than 1,400 of them were from the 2025 season itself, meaning that we kept the database up-to-date in close to real time.
Do the math, and you’ll see that we boosted the historical data, as well. 2025 brought in nearly 800 matches from previous seasons. While we long ago finished up the biggest matches of the past (slam finals and semi-finals, masters finals, big-four meetings, etc.), we’re continuing to flesh out the 30-plus years before the start of the project. Contributors dug into the archives and charted dozens of tour-level finals, second-week slam matches, and consequential Davis Cup rubbers.
Of all the stats I could cite to illustrate the MCP’s progress, my favorite is that 2025 saw more contributors than any previous year. 32 different people charted matches. Three contributors (plus yours truly) have crossed the 1,000-match mark, with one more likely to do so in the next few weeks. Another dedicated contributor has already submitted 300 matches despite getting started barely one year ago.
You can help, too. 1,400 current-year matches sounds like a lot–it is a lot!–but it is only represents about one-quarter of tour-level contests. (Plus, we do ITFs and Challengers!) We have Sabalenka, Swiatek, Alcaraz, Sinner and a few other personal favorites pretty well covered, but there’s always a need to deepen our coverage of the rest of the tour.
Here’s the Quick Start Guide. Charting isn’t for everybody, and it takes a little time and effort to learn. Still, you might be one of the select few to discover that you love it.
The benefits accrue to the entire tennis community. In addition to the detailed match reports (like this one for the Sincaraz US Open final), the Tennis Abstract site has detailed charting data on every player page (here’s Mirra) and leaderboards full of stats you won’t find anywhere else.
Much of the raw data is available, as well. The MCP is one of the most underrated, underused tennis datasets. Like charting itself, it’s complicated: Making sense of shot-by-shot data is tricky business, even before you write your first line of code. But if you want to go beyond aces, break points, and Elo ratings, this is where you’ll end up. A ton of the research on this blog is powered by MCP data, and I always feel like I ought to do more.
Here’s to an even better 2026 full of charts both epic and obscure. I hope you’ll join us.
Four years ago, when I started work on the Tennis 128, Carlos Alcaraz was 18 years old. He was ranked 32nd on the ATP computer. Now, six(!) major titles later, I’m officially adding him to my pantheon of greats.
The algorithm I devised for the Tennis 128 was designed to measure entire careers, so it takes a herculean effort someone so young to make the cut. Since a 22-year-old can’t yet amass impressive career stats, the key is to achieve a historically great peak. That was Jannik Sinner’s path onto the list last year. Alcaraz climbed nearly as high, flirting with the 2300-Elo threshold after his US Open title this year.
With that newly-established level and one more season at the top of the game, Alcaraz debuts on the list at #83, displacing a couple of Australians, Jack Crawford and Lleyton Hewitt.
(As in the past, I’m not going to kick anybody out, so the Tennis “128” is up to 132 members.)
The Spaniard is the only big mover on the list this time around. The algorithm has three components: peak Elo, year-end Elo for a player’s five best seasons, and year-end Elo for the entirety of his or her career. Players can improve their lot by posting an additional great season, as Sinner did. But without bumping their peak Elo, there’s only so much one can do in a single season. In my view, that’s how it should be. This is, after all, a ranking of entire careers.
Three other young, active greats had already muscled their way onto the list, and all three saw modest gains in 2025:
Aryna Sabalenka won another major–among many other titles. Her run to the final in Riyadh even nudged her Elo up to a new career peak, if only slightly. She slides just past another big hitter, Petra Kvitova, to a new place at #105.
Jannik Sinnermatched Alcaraz blow for blow, often (almost) literally. While he didn’t improve on his peak Elo, he finished the year atop the list with another near-2300 showing. He moves up to #66.
Iga Swiatek is no longer as imperious as she was at her best. But she remains one of the top two players in the game. She gains two places to #91.
2026 might be the first year without any new additions to the list. Alexander Zverev and Daniil Medvedev have hovered within striking distance for a few years now, but without a significant step forward–say, a 50-point increase on their peak Elo ratings–they will likely remain on the outside looking in. No other active men are close.
Coco Gauff is probably the most likely next debutante, but she has even more ground to cover. Elo doesn’t rate the current era very highly. While the Tennis 128 does apply some modest era adjustments, a string of years at number three right now isn’t going to do the job. For Gauff to join the club twelve months from now, she’ll probably need a multi-slam, year-end-number-one season.
I wrote last week about the decline of specialization on the men’s tour. I proposed that we see more good all-around players because, as the overall level improves, there’s less relative value in being a one-dimensional servebot or dirtball grinder.
A few people responded–and I paraphrase, slightly: It’s the surfaces, stupid.
Everybody seems to agree that at some point, let’s say between peak Sampras and peak Djokovic, surface speeds converged. Hard courts got slower, and some grass courts got slower, too. Serve-and-volleying mostly disappeared, and grinding baseline play took over.
The only debate, it seems, is why. Was it a conspiracy to give the fans (well, all the fans except for the ones complaining) what they wanted? Is it the balls? The rackets? The strings?
I’ve always been skeptical of the conspiracy theory. More generally, I have been–and still am–skeptical that playing conditions have changed that much. Just because everybody believes something–even if those people are top-ranked players and well-respected pundits–doesn’t make it true. The historical record shows that styles have changed, but it’s much harder to marshal evidence that the surfaces themselves are meaningfully different than they were 20 or 30 years ago.
A quick review
I’ve looked at this stuff before. Here’s a quick summary:
The Mirage of Surface Speed Convergence (2013): I compared ace rates and break rates on hard and clay courts for pairs of players, 1991-2012. I found that the difference between hard courts and clay courts had, if anything, slightly widened, even though the conventional wisdom of convergence was fully in place by then.
The Grass is Slowing: Another Look at Surface Speed Convergence (2016): I wish I had named this differently, because I didn’t show that the grass slowed, I showed that rally lengths at Wimbledon (and to some extent at the hard-court slams) were converging with those at Roland Garros. It was my first stab at the problem using Match Charting Project data, which meant it used rally length, instead of ace and break rates. However, it relied on limited data, which meant there were heavy biases in which players it measured.
Surface Speed Convergence Revisited (2023): With more MCP data, I worked out a simple model of how much surface affected rally length, and how the effect had changed over time. Now without the selection bias, I showed that in both men’s and women’s tennis, the influence of surface on rally length had shrunk.
Pick your stat
To grossly oversimplify: If you look at ace rate, there’s no evidence of surface convergence. If you look at rally length, there is.
I didn’t want to rely on a 2013 mini-study for the ace-rate conclusion, so I came up with some new fodder.
My surface-speed ratings are based entirely on ace rate. Originally, this is because we don’t have better stats going very far back, while we do have ace rate for all ATP matches since 1991. The MCP has an increasing amount of coverage, but it is not complete, and the ace-based ratings have always seemed to capture surface-speed differences pretty well. There’s some noise, because there are only so many matches per tournament per year. But in general, they give us a pretty good idea of what’s going on.
The downside is that they are indexed to each year’s average. The rating for the 1991 edition of Wimbledon is 1.20, meaning that–controlling for the mix of players–there were 20% more aces than a 1991-average event. This year, Wimbledon’s rating was 1.12: 12% more aces than the 2025 average. But are those averages the same?
That question offers us a neat little experiment. Instead of indexing on a single-year average, why not do two years at a time? The pool of players was almost identical in 1992 as in 1991, so it’s a fair comparison. As it turns out, Wimbledon’s ace-based surface rating went down from 1.20 to 1.06 between 1991 and 1992. That kind of shift often happens due to randomness, but maybe it could be validated by a longer trend. Looking at two years at a time–1991 and 1992 together, 1992 and 1993 together, up to 2024 and 2025 together–allows us to make the same comparisons for the entire tour calendar, for a span of 35 years.
Well, in that span, ace rate has gone up quite a bit. And not just because mediocre servers have been replaced by better ones. On average, the same servers (against the same returners, though the returner effect is much smaller) have upped their ace rate about 2% every year. Not enough to notice as it happens, but enough to move the ATP tour average ace rate from below 7% in 1991 to a bit over 10% today. Some of the difference is due to the tournament mix–a shorter clay calendar, mostly. But I ran the same analysis on a core group of 15 events that have been in the same place since 1991, and the controlled-for-players increase is still 1.6% per year.
What about convergence, taken literally? Have faster events gotten slower, while slower events have sped up?
Nope! The variance between tournament ratings is almost exactly the same in 2024-25 as it was in 1991-92. An example: Back then, Wimbledon’s two-year average was 1.13, while Monte Carlo was 0.58. Over the last two years, Wimbledon’s rating has been 1.14, with Monte Carlo at 0.57.
It’s the strings…
How do we reconcile the evidence that ace rate has gone steadily up, while rally length has also increased?
Setting aside laboratory-type measurements (like CPI/CPR, which we don’t have far enough back, anyway), the purest way to measure court speed is ace rate. A slow court keeps the ball on the ground longer and slows down the rest of its trajectory. Returning is all about reaction time, and ace rate tells us whether returners physically got there or not. That’s why there are, reliably, so many more aces on hard and grass courts than on clay, and on faster hard courts than slower hard courts.
Now, it could be that players have gotten stronger, serve tactics have gotten less predictable, and racket/string technology allows servers to put the ball in the corner more often. All of that is probably true, so the 2%-per-year average likely overstates the change in surface. The ace increase might entirely be attributable to training and tech. But if you want to argue that surfaces have gotten slower, you’ve got an uphill battle to explain how aces have gone so far in the wrong direction.
The rally-length trend is easier to explain. Unlike ace rate, shots-per-point isn’t just about how the ball interacts with the surface. It’s about tactics and spin.
And actually, tactics are themselves largely about spin. And spin, well, that brings us to polyester strings.
Modern topspin is possible largely thanks to polyester strings. The best-known milestone is Gustavo Kuerten’s 1997 French Open title, the first major won with a Luxilon-strung racket. It took a few years for everybody to make the switch, but polyester string was kryptonite for serve-and-volleying. Now it was possible to hit returns that dipped to the server’s feet at the net. All that topspin also made it tougher to move forward. More topspin meant that deep groundstrokes were higher-percentage shots, and that opponents needed to give up even more ground to comfortably handle them.
When I wrote about Lleyton Hewitt a few years ago, I showed how Hewitt forced Roger Federer to basically give up serve-and-volleying. That was 2002-05. If it hadn’t been Hewitt, it would’ve been someone else–or everybody else.
Less serve-and-volleying, safer groundstrokes, fewer net approaches overall … all that adds up to longer rallies. No surface change necessary.
… and the youth
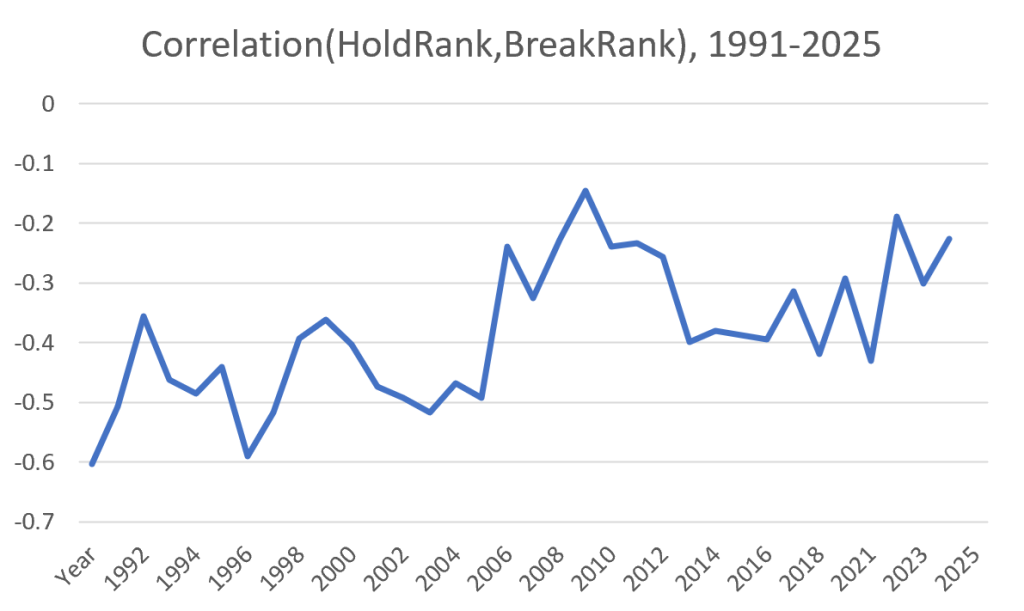
Let me show you the graph from my decline-of-specialization piece again. Generally speaking, it shows how much serve skill is related to return skill. Higher numbers (closer to zero) indicate a closer relationship, or in tennis terms: more all-around players.
Someone on Twitter reasonably asked, what’s up with the peak around 2008-2010? It’s a noisy graph, but a plausible interpretation is that it breaks down into two segments. Up to 2005, most of the data points are between -0.4 and -0.5, with a couple on either side. Since then, the line rarely dips below -0.3. (2013-16 leaves some explaining to do.) Accept this reading, and 2008-10 isn’t a stand-alone peak, it’s the solidification of a new era.
What else was going on in 2008-10? Novak Djokovic won his first slam, and Rafael Nadal established himself as an all-court force. In short, this is when people really started talking about surface speed convergence. Probably not a coincidence.
But why then? Well, in the spring of 1997, the tennis world figured out that polyester strings weren’t just the misguided side-hustle of a bra-strap company. Players with an eye on the future started to switch.
When Guga lifted his trophy, Nadal was 11 years old. Djokovic was 10.
The learning curve
Professional tennis is tough. Players like their gear. They’re used to their gear. It took years for Federer to give up his 90-square-inch frame. Sampras never did abandon his 85-square-incher. When a pro finally does switch, the benefits are hardly instantaneous. It might even mean a temporary step back.
The ultimate advantages go to the tech-natives. For all of Kuerten’s success with Luxilon, he was never going to wring the full benefit of the new technology and the tactics that it implied. If a certain racket/string setup is optimal, the players who do the most with it will be those who built their entire games around it. I don’t know whether the critical age is 8, 11, or 14 (maybe it helped Federer that he was a bit of a late bloomer), but it definitely isn’t 20 or 25.
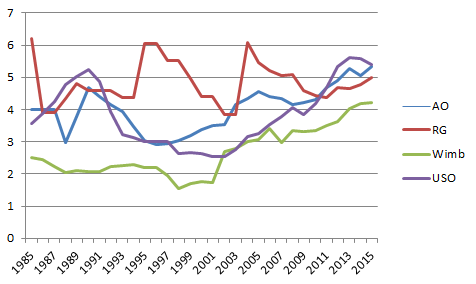
Check out the rally-length graph (based on slam finals) from my 2016 piece:
Wimbledon went from a low in 1998-2001 to a completely different level by 2006-08. Not a coincidence. The slam-finals graph tells the story of a select few guys, but by the late 2000’s, a whole generation of polyester natives–Djokovic, Nadal, Murray, Nalbandian, Berdych, Ferrer, Monfils–had taken over.
None of this requires the surfaces to change one iota. Maybe fans or tournament directors wanted longer rallies, maybe they didn’t. They were going to get baseline tennis no matter what.
Playing styles converged because topspin-powered strategy works across surfaces in a way that no previous style did. Rallies got longer because the players who tried to shorten them were stranded in the forecourt. They fumbled half-volleys into the net or watched passing shots as they whizzed by. Surfaces ended up as the scapegoat for a new era, but they didn’t cause it.