The Manufactured Attack of Caroline Garcia

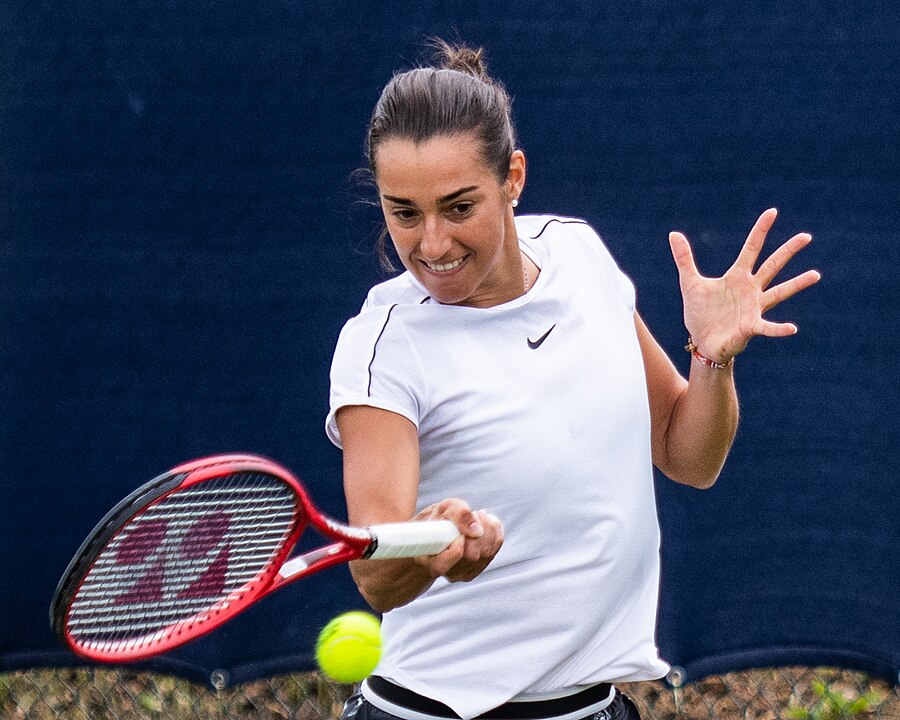
Caroline Garcia in 2019. Credit: Peter Menzel

Last night, Caroline Garcia scored what many fans saw as an upset, straight-setting two-time Australian Open champion Naomi Osaka. While Garcia was seeded 16th and Osaka is just beginning a comeback, no one ever knows quite what to expect when the Frenchwoman takes the court. The former champ, for her part, has always been at her best on big stages.

The result was almost pedestrian. Garcia turned in a performance that exemplified the tennis of her late 20s: Serving big, returning pugnaciously, taking risks, and–on the rare occasions that Osaka left her an opening–net rushing. Osaka served well, but the 16th seed out-aced her, 13 to 11. More than three-quarters of points were decided in three shots or less, and Garcia stole a few more of those from her opponent than Osaka did from her. In a contest defined by small margins–one break of serve and a tiebreak–that was all it took.

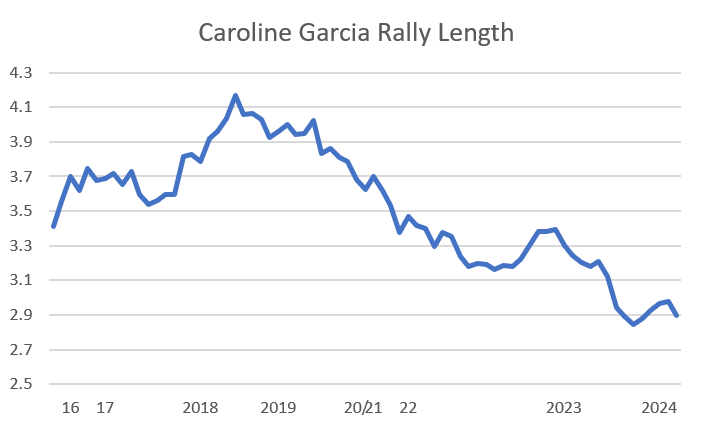
The strange thing is, Caro didn’t use to play like this. She plays shorter points than any other tour regular, an average of 2.9 shots per point in charted matches from the last 52 weeks. It isn’t just about her powerful first serve: Her return points end even sooner than her serve points do. Back in 2018, when she first reached her career-best ranking of 4th on the WTA computer, she was averaging over four shots per point, a rally length that would put her in the range of Jessica Pegula and Maria Sakkari: in other words, a very different sort of player.

Here is the evolution of Garcia’s rally length, shown as a rolling 10-match average, for the 84 matches in the charting dataset:

Last night’s rally length was a blink-and-you’ll-miss-it 2.5 shots, the second-lowest figure I have on record for Garcia. Only a match against Donna Vekic last year comes in slightly lower, though last week’s match in Adelaide against Jelena Ostapenko may have been even more extreme. Osaka’s big game helped keep the number down, but it takes two to so comprehensively avoid the long-rally tango.

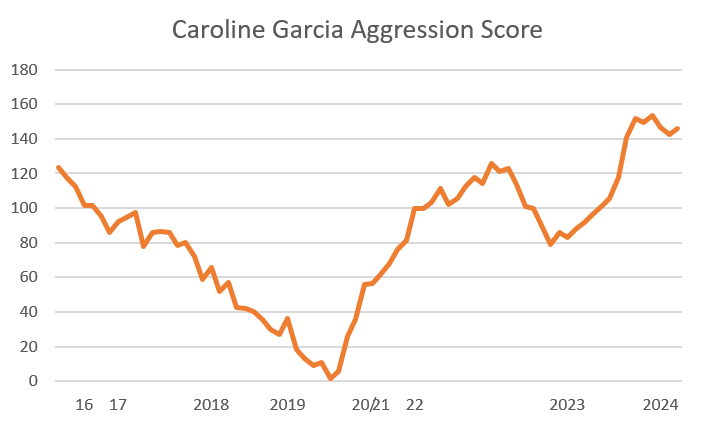
Garcia’s first serve has always been a weapon. But her tactical approach behind it has fluctuated wildly. The career trend of her Aggression Score in rallies illustrates how she has careened from one extreme to another. Aggression Score is scaled so that the most passive players rate around -100 and the most aggressive around 100, though Ostapenko and others have pushed the maximum figures further into triple digits. Here is how Garcia’s score has changed over time, again as rolling ten-match averages:

I don’t think there any other player in tennis–man or woman, past or present–who has followed a path like this. As she established herself as an elite on tour, even as she rose into the top five, she became more and more conservative. For reference, players who posted scores around zero in 2023 were Sakkari and Martina Trevisan, hardly styles that will remind you of Garcia’s. Eventually she reversed course, not only regaining her former style but surpassing it, ranking among Liudmila Samsonova and Aryna Sabalenka as one of the most aggressive players on tour, a rung below the class-of-her-own Ostapenko.

Is it working?

The oddest thing about the multiple phases of Garcia’s career is that she has reached the No. 4 ranking with two different styles. In each of her first three charted matches after achieving the peak ranking in 2018, she posted negative rally aggression scores. In two matches against Sabalenka, she averaged 3.9 and 3.7 shots per point; against Karolina Pliskova in the Tianjin final, the typical point lasted 4.3 strokes. When she returned to the No. 4 ranking at the end of 2022, after years in the wilderness, she was frequently posting triple-digit aggression scores and average rally lengths below 3.

The main effect of Garcia’s current style is that it makes the most of her serve. From 2015 to 2017, she won just over 66% of her first-serve points, a mark that is good but sub-elite. She fell all the way to 62% in 2021 before the big shift; since then, she has won more than 70% of her first-serve points. She ranked fourth in that stat heading into the Australian Open, and she converted nearly 90% of her first serves against Osaka. Her success behind the second serve hasn’t shown the same improvement, but the overall picture is a good one: She won more total serve points in 2023 than ever before.

The return game is a different story. This is where even a casual viewer can’t miss Caro’s new tactics: She’s not afraid to stand well inside the baseline to return serve, and yesterday she net-rushed one Osaka serve, SABR-style. Measured by court position, if not by winners and error stats, Garcia is even more aggressive than Ostapenko.

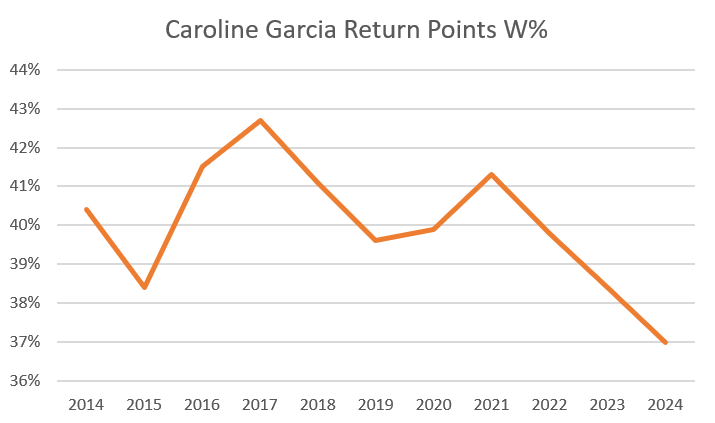
At her best, the Frenchwoman posted acceptable return numbers, if not great ones. Her best single-season mark, winning 42.7% of her return points in 2017, put her in the bottom third of top-50 players. As she has upped the intensity of her attack, this key number has headed south:

In the last 52 weeks, she has won just 38.3% of return points, worst among the top 50 by two full percentage points. Among the top 20, no one else is below 42%. She can get away with it because her own serve is so rarely broken, but such ineffectual return results will make it difficult to mount another assault on the top five. Breaking serve so rarely dooms her to a career of three-setters and narrow decisions. Those sorts of results can sometimes be encouraging–as in her pair of recent three-set losses to Iga Swiatek–but have a knack for halting winning streaks, too.

It doesn’t have to be this way. Players don’t sign contracts agreeing to deploy the same tactics on both sides of the ball. Garcia won return games far more often in her less aggressive days, breaking 33% of the time in 2017 compared to a dreadful 23% last year.

Some of Caro’s 2017 skills are still in evidence. She is solid enough in long rallies that she doesn’t need to so actively avoid them: In the last year, she has won a respectable 48% of points that lasted seven or more strokes, and if you remove the two Swiatek matches, she breaks even. While the Osaka match was primarily determined by short points, Garcia won 17 of 29 (59%) that went to a fourth shot.

Without any major changes, Garcia will remain the sort of player who aggravates fans and opponents alike, a dangerous lurker capable of delivering upsets, inexplicable marathons, and lame early exits in equal measure. Like any hyper-aggressive player, Caro’s results can be seemingly random, with all the frustration that entails. Unlike Ostapenko, Sabalenka, and the many ball-bashers on tour, though, Garcia has chosen to play this way, rebuilding her game into something that the 2018 version of herself would hardly recognize. If she can somehow join her late-career serve to her earlier return-game tactics, the randomness will disappear, and Caro may make yet another appearance in the top five.

* *

Subscribe to the blog to receive each new post by email:
 

The Improbable Rise of Emma Navarro

Also today: New stat leaderboards

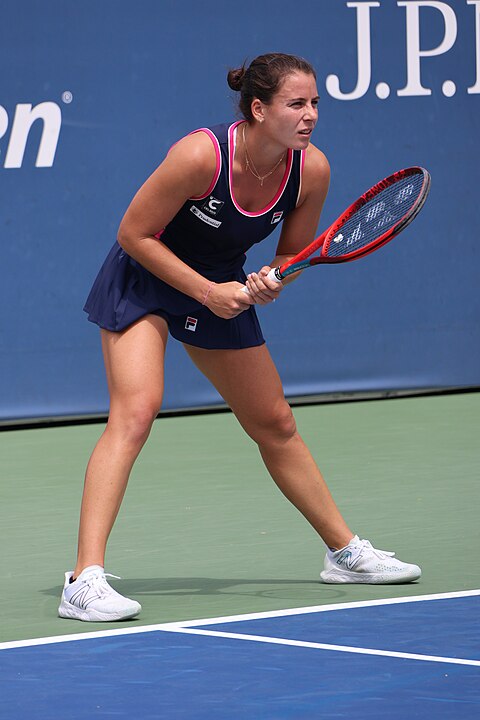
Emma Navarro at the 2023 US Open. Credit: Hameltion

When Emma Navarro beat Elise Mertens for her first WTA title in Hobart on Saturday, it was only part of a natural progression. For more than a year now, she has shown a knack for winning, regardless of level, surface, or just about anything else. While most fans still don’t know her name, she’s up to 26th in the official rankings and 22nd on the Elo list.

The former collegiate champion–winner of the national title as a Virginia Cavalier in 2021–started her 2023 campaign just inside the top 150. She arrived at the brink of the top 100 with back-to-back ITF titles on clay in April, then cracked the top 60 with a grass-court final in Ilkley. Her first top-ten win came in September on hard courts, against Maria Sakkari in San Diego, and after a busy fall that included another two ITF titles, she broke into the top 40. She’s 8-1 so far in 2024; the only blip is a loss to Coco Gauff.

Altogether, that’s 72 victories since the beginning of last year. Not many women can boast so much success at the W25 level or higher in that span:

Player                   2023-24 Wins  
Arina Rodionova                    79  
Iga Swiatek                        73  
Emma Navarro                       72  
Oceane Dodin                       64  
Jessica Pegula                     62  
Julia Riera                        59  
Aryna Sabalenka                    59  
Martina Capurro Taborda            59  
Yafan Wang                         58  
Carlota Martinez Cirez             57

The remarkable part of Navarro’s rise is not the sheer quantity of positive results; it’s that she rose through the rankings so fast at the age she did. She first cracked the top 100 last May just before her 22nd birthday–hardly old by any rational standards, but nearly geriatric on the youth-driven WTA tour. The 25 players standing in front of Navarro in this week’s rankings broke into the top 100, on average, before their 20th birthday: The median is Aryna Sabalenka’s arrival at 19 years, 5 months. Late developers like Jessica Pegula, Barbora Krejcikova, and Navarro are exceptions to a long-standing rule.

It’s not unusual for a player to finally achieve a double-digit ranking when they are 21 or older, but it’s rare for a future star to do so–and now that Navarro is a tour-level title-holder ensconced in the top 30, she deserves that label. Since 1990, there have been 207 players who finished their age-21 season ranked between 101 and 200 without a previous appearance in the top 100. Only 25 of them reached #100 at the end of the following year; Navarro was only the fourth to crack the top 50.

Of those 200-plus players, only 35 of them ever achieved a top-40 ranking. (A few more, including Katie Boulter and Katie Volynets, could still join the group.) On average, it took them 1437 days–just short of four years–to do so. Navarro needed only 315 days, the second-fastest in the last 30-plus years. Here are the players who made the fastest move from the end of their age-21 season to the top 40:

Player                 Age 21  top 40 debut  Days  
Elise Mertens            2016    2017-08-28   245  
Emma Navarro             2022    2023-11-06   315  
Veronika Kudermetova     2018    2019-11-11   315  
Kurumi Nara              2012    2014-06-09   525  
Jamie Hampton            2011    2013-06-24   546  
Casey Dellacqua          2006    2008-07-28   581  
Tathiana Garbin          1998    2000-09-25   637  
Liudmila Samsonova       2019    2021-11-01   672  
Bethanie Mattek Sands    2006    2008-11-03   679  
Anne Kremer              1996    1999-04-12   833  
Jil Teichmann            2018    2021-04-26   847  
Zi Yan                   2005    2008-05-05   861  
Paula Badosa             2018    2021-05-24   875  
Yone Kamio               1992    1995-06-12   896  
Alison Riske Amritraj    2011    2014-06-09   896  
Johanna Konta            2012    2016-02-01  1127

It’s possible that Navarro could have been ready for the big time earlier had she not spent two years playing college tennis. Her sub-100 ranking at the end of 2022 was partly due to a limited schedule, as she played only a handful of tournaments before leaving school after the spring semester that year. But she wasn’t playing top-100 tennis when she did step on court: Elo ratings respond much more quickly to quality results (and do not reward quantity for its own sake), and her ranking by that algorithm, 148th, was virtually identical to her place on the official list.

Whatever the benefits and (temporary) costs of her stay at the University of Virginia, Navarro seemed to learn from the step up in competition–and quickly. She lost her first 11 matches against the top 50; in the last four months, she has won 5 of 6.

What works

The most memorable victory so far was Saturday’s triumph over Mertens for a debut WTA title. It was a grind, taking two hours, 50 minutes, and spanning 14 breaks of serve en route to a 6-1, 4-6, 7-5 finish. There was little first-strike tennis on display, as the average point ran to 5.5 strokes. 69 points required seven shots or more, and 37 reached double digits.

The battle for openings worked to Navarro’s advantage. In a sample of eleven previous matches logged by the Match Charting Project, she struggled in longer rallies, winning just 46% of points that reached a seventh shot compared to 49% overall. On Saturday, she reversed that trend in a big way, out-point-constructing her veteran opponent and winning a whopping 59% of the longer points. Of 84 charted Mertens matches, it was only the eighth time that she played at least 20 long points and won so few of them. Among the few players to beat her so soundly on rally tactics: Pegula and Simona Halep.

While Navarro’s results have steadily improved, her game plan is still recognizable form her days as a college champion. After defeating Miami’s Estrela Perez-Somarriba for the 2021 NCAA title, she described her approach: “I was able to dictate with my forehand and finish a lot of points with my backhand.” In Hobart, her backhand continued to populate the highlight reel, with seven clean down-the-line winners. But it was the forehand that opened the court in the first place.

She played, essentially, a clay-court match, using the forehand to create opportunities for the next ball. She hit winners with 7% of her forehand groundstrokes, slightly below tour average. But when she was able to hit a forehand, she won the point 62% of the time, an outstanding figure for a close match. One point serves as an illustration of the rest: At 2-all, 15-all in the third set, Navarro converted a return point with a down-the-line backhand winner on the 14th shot of the rally. After a deep forehand return, Navarro was forced to hit two backhands. When she was finally able to deploy the forehand on the 8th shot, she stabilized the point by going down the middle. The 10th shot took advantage of a let cord with a heavy crosscourt forehand, a weapon that worked in her favor on Saturday more than two-thirds of the time. Her next forehand went the other direction, creating the space for–finally–a backhand out of the Belgian’s reach.

While not every point was quite so tactical, point construction always lurked. Mertens frequently attempted a pattern where she would go the same direction with two consecutive groundstrokes then, having wrong-footed Navarro with the second of them, go for a winner. The sequence doesn’t work against a big swinger because the points don’t last long enough. That wasn’t a problem against the American, but Navarro’s resourcefulness nullified the tactic nonetheless. Unlike many players her age, Navarro is able to use slices off both wings to neutralize points, and she often did so on the second shot of Mertens’s would-be pattern. The Hobart champion hit 40 slices over the course of the match, ultimately winning the point on 20 of them. For a defensive shot, rescuing 50% of those situations counts as a victory.

There is little in Navarro’s game that advertises her as a world-beater: The weapons I’ve described work best as part of a carefully-managed package. She may prove to be most dangerous on clay, where aggressive opponents will have a harder time keeping points short. She might also develop yet another level. Twelve months ago, only a reckless forecaster would have predicted she could rise so high, so quickly. We still haven’t seen her peak.

* * *

Deep leaderboards

Among the cult favorites on the Tennis Abstract site are the tour leaderboard pages, which contain nearly 60 sortable stats for the top 50 players on each circuit. Many of those stats aren’t available anywhere else, including things like average opponent ranking and time per match. It’s also possible to filter the matches for each calculation to determine things like the best hold percentages on clay.

Last week I introduced three new pages that extend the same concept:

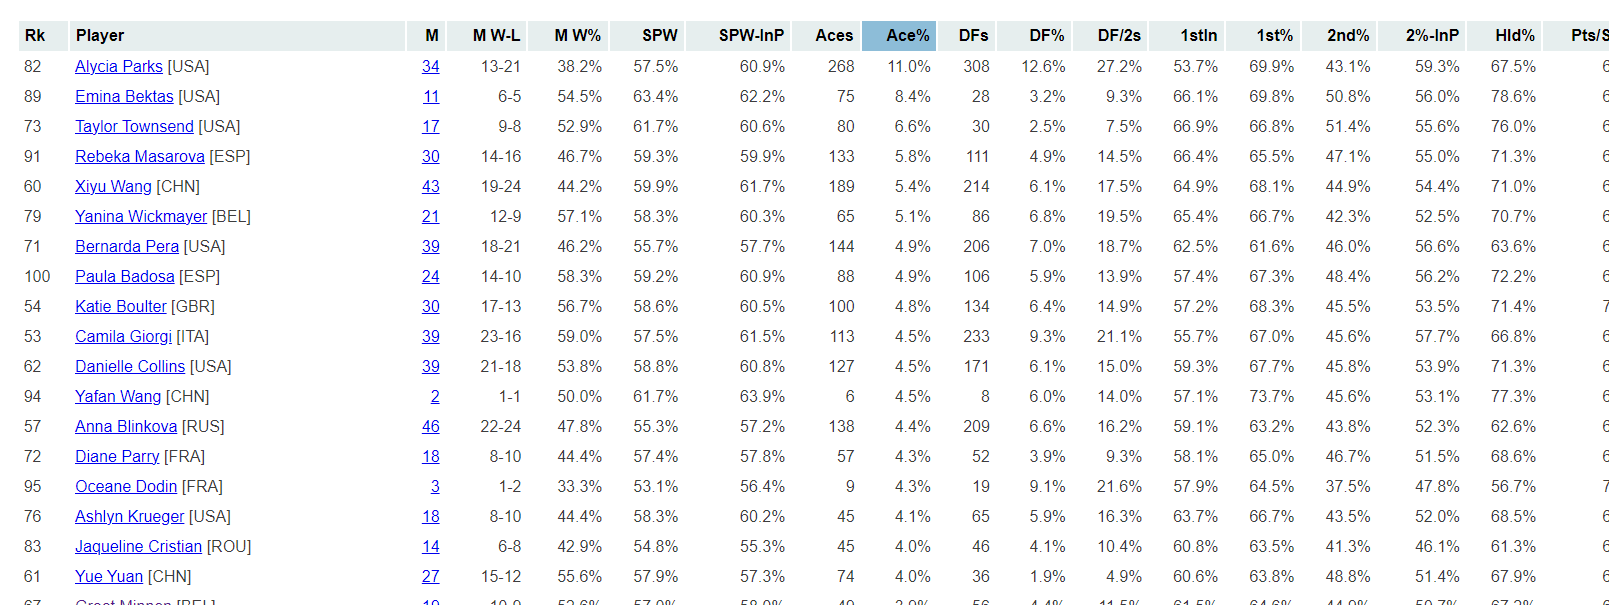
Here’s just one example of what’s possible, the best WTA players outside the top 50 by ace percentage:

These are a great way to identify standout skills of lesser-known players. All of the leaderboards update every Monday.

* * *

Subscribe to the blog to receive each new post by email:
 

Jelena Ostapenko In the Hands of Fate

Also today: Deciding tiebreaks, a MCP milestone, and assorted links.

Jelena Ostapenko in 2023. Credit: Hameltion

If you’ve ever spent five minutes watching Jelena Ostapenko play tennis, you know she’s as aggressive as it gets. She swings for the fences and sometimes knocks them over. Get her on a hot streak, and opponents can only hope its ends before the handshake. When she’s off her game, spectators in the first few rows duck for cover.

What you might not realize is just how aggressive she is. A few years ago I tuned Lowell West’s Aggression Score metric so that the numbers fell in a range between 0 and 100. In theory, 0 is maximally passive; 100 is go-for-broke, all the time. Ostapenko’s career Aggression Score in rallies is 175.

This sort of extreme style lends itself to all sorts of narratives. She can beat anybody, any time, as she showed when she won the 2017 French Open as an unseeded player, and again last year when she upset Iga Swiatek at the US Open–her fourth win in as many matches against the Pole. That makes her a perennial dark horse pick at majors. Even though she hasn’t reached a semi-final since 2018, neither Iga nor Coco Gauff–who exited the Australian Open after an Ostapenko barrage last year–would like her find her in their section.

(Sorry Iga: Guess who you might face in the quarters!)

Hyper-aggressive players also appear to be works in progress. Especially early in Ostapenko’s career, commentators would talk about her stratospheric potential if she could only improve her footwork, or play a bit more “within herself.” That is, not quite so many winners, not quite so soon, more point construction, fewer unforced errors. But players rarely change much, and as they age, they are more likely to become more aggressive, not less. The Latvian is now 26 years old, beginning her ninth year on tour. What you see is what you get.

What you get, it turns out, is a lot of close matches. Ostapenko played 30 three-setters last year, including four in a row to reach the Birmingham final and another four straight to start the US Open. Alona’s apotheosis came at Indian Wells, when she faced fellow super-aggressor Petra Kvitova in the third round. Both women tallied exactly 75 points; Kvitova won, 0-6, 6-0, 6-4. Tennis ball fuzz could be seen floating over the desert for days afterward.

That particular scoreline was an oddity, but the margin of victory was not. Ostapenko’s tight matches are not a result of streakiness, flightiness, or anything of the sort. They are an unavoidable function of her game style. It’s almost impossible to hit lots of winners without also committing piles of unforced errors. (We’ll come back to that.) When you do both in such numbers, you personally account for a substantial majority of point outcomes. The winners and errors (very approximately) balance each other out, and unless your opponent does something remarkable–or remarkably bad–with the limited influence you leave her, you end up winning about half the points played.

No one takes the racket out of an opponent’s hand like Ostapenko does. Once the return is in play, the Latvian ends nearly two-thirds of points herself, with a winner or unforced error, or by forcing an error. No one else comes close. Drawing on Match Charting Project data, I’ve listed the active players who end the most rallies:

Player                 RallyEnd%  
Jelena Ostapenko           65.9%  
Petra Kvitova              61.6%  
Madison Keys               60.8%  
Liudmila Samsonova         60.0%  
Camila Giorgi              59.7%  
Aryna Sabalenka            59.7%  
Veronika Kudermetova       57.5%  
Danielle Collins           57.5%  
Ekaterina Alexandrova      57.2%  
Ons Jabeur                 56.8%  
Peyton Stearns             56.5%  
Caroline Garcia            56.2%  
Naomi Osaka                56.2%  
Varvara Gracheva           55.0%  
Iga Swiatek                55.0%

Here’s another way to look at Alona’s extreme position on this list. The only other woman to grade out so far from 50% is Madison Brengle, who ends fewer than 34% of rallies. Ostapenko’s power turns the rest of the tour into Brengle.

Give and take

Ending even 57% of points on your own racket requires a lot of big swings. When you aim for a line, you might feel confidence about your chances, but you are taking a risk. A few players, like Swiatek, can generate winners without paying the unforced-error penalty, but that takes an unusual combination of patience and power that most players do not possess.

The 66% of points that Ostapenko ends on her own racket divides into roughly 37% winners (and forced errors) and 29% unforced errors. That’s worse than Aryna Sabalenka, who hits nearly as many winners with only a 23% error rate, but compared to the tour as a whole, the ratio is a solid one. For every unforced error she commits, she ends 1.25 points in her favor. Average among players represented in the Match Charting Project is 1.16, and the true mean is probably lower than that, since the MCP is more heavily weighted toward the best players.

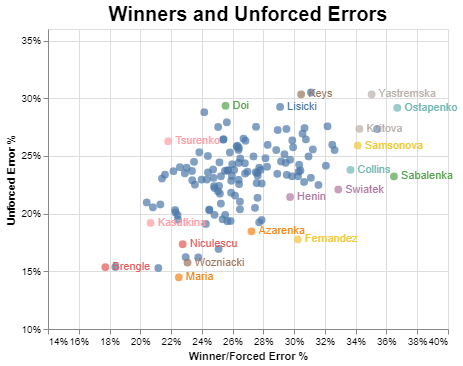
The ratio varies among players, but there is a fairly strong relationship. Here are the winner/forced error and unforced error rates–each as a percentage of all points where the return came back in play–for 140 current and recent players:

The correlation between the two rates (r2 = 0.3) would be even stronger if it weren’t for net-rushers like Tatjana Maria–and to some extent Leylah Fernandez–who force their passive opponents into more aggression than they would otherwise produce.

As Sabalenka shows, it’s possible to seize as many points as Ostapenko does without giving quite so many away, but even that may be a mirage: Sabalenka racks up winners behind an overpowering serve that the Latvian can’t match. If the plot above is any indication, it would be difficult to bring her error rate down without also sacrificing some winners, not to mention the élan that she has ridden to seven tour-level titles.

So we’re left with something of a paradox. A hyper-aggressive player has more control over her fate than her peers do, but that control comes at a cost of a towering error rate, which keeps matches close. One result is a week like this one in Adelaide, where Ostapenko has reached the final by slipping through perilously tight battles with Sorana Cirstea (51.7% of points won) and Caroline Garcia (50.2%). Both matches could’ve gone the other way, something that is true so often when the Latvian steps on court. My tactical advice for Daria Kasatkina in tomorrow’s final: Cross your fingers.

* * *

Deciding-set tiebreak records

AbsurDB asks:

[A]m I right that Hurkacz’s 15 deciding sets going into tie-breaks in one calendar year is a historical record in ATP (10 such tie-breaks won is also probably a record?)?

Indeed, both are records. According to my data, the previous records came from Ivo Karlovic’s 2007 season, when he reached 11 deciding-set tiebreaks, winning eight of them. Here are all the player-seasons with nine or more.

Player              Season  Dec TB  Record  
Hubert Hurkacz        2023      15    10-5  
Ivo Karlovic          2007      11     8-3  
John Isner            2011      11     4-7  
John Isner            2018      11     6-5  
Ivo Karlovic          2014      10     7-3  
John Isner            2017      10     5-5  
Kevin Anderson        2018      10     6-4  
Mark Philippoussis    2000       9     5-4  
Marat Safin           2000       9     5-4  
Ivan Ljubicic         2002       9     2-7  
Ivan Ljubicic         2007       9     8-1  
Ivo Karlovic          2008       9     5-4  
Sam Querrey           2018       9     1-8  
Borna Coric           2019       9     6-3  
Hubert Hurkacz        2022       9     3-6

(Yes, I checked before 2000, as well, but no one reached nine until Philippousis did so that year. The first player-season with eight deciding-set tiebreaks was Tom Gullikson’s, in 1984.)

* * *

MCP Milestones

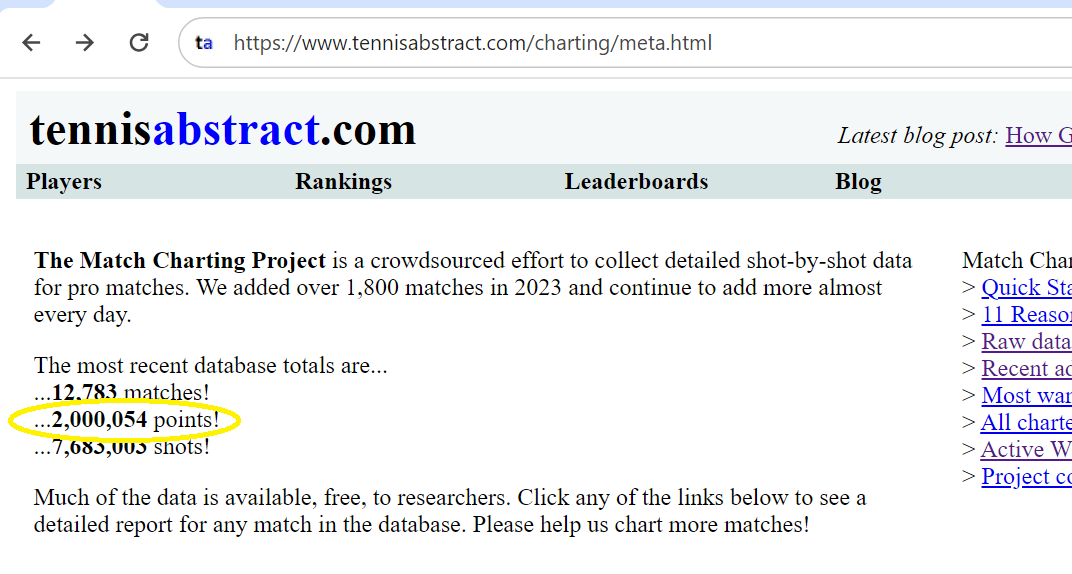
Earlier this week, the Match Charting Project recorded its two-millionth point:

The milestone match was the Auckland second-rounder between Ben Shelton and Fabian Marozsan, which I charted as a warm-up for my article on Wednesday. We’re not resting on our laurels, of course: We’ve added another five matches (and 800 or so points) in the 48 hours since.

Also worth mentioning is another round number we reached in the offseason: 1,000 different ATP players. Apart from the name syou’d expect, it’s a healthy mix of lower-ranked active players and former tour regulars. #1,000 was Martin Jaite, via his 1987 Rome final against Mats Wilander. We’ve also now charted 800 different WTAers.

We stand about 200 charts away from 13,000 matches overall: approximately 7,000 men’s and 6,000 women’s. 2023 was our most productive year yet, and 2024 would be a great time to start contributing.

* * *

Assorted links

  • Earlier this week I appeared on Alex Gruskin’s Mini-Break Podcast, in which he got overexcited about a number of week one trends, and I tried to talk him down from all the ledges.
  • I wrote about how GPT4 helped me make Tennis Abstract’s new navbar, because you had to know I didn’t do it myself.
  • The tours have introduced a new policy on late matches. I’m underwhelmed: There are an awful lot of exceptions, and there’s no acknowledgement of the underlying problem of longer and longer matches.
  • Two student projects worth a look: Pramukh’s Evaluating Tennis Player Styles in Relation to Tour Averages, based on MCP data, and Amrit’s Aces over Expected model.
  • If you can’t wait until Sunday for grand slam tennis, here’s the Clijsters-Henin 2003 US Open final.

* * *

Subscribe to the blog to receive each new post by email:
 

How Grigor Dimitrov Unbalanced Holger Rune in Brisbane

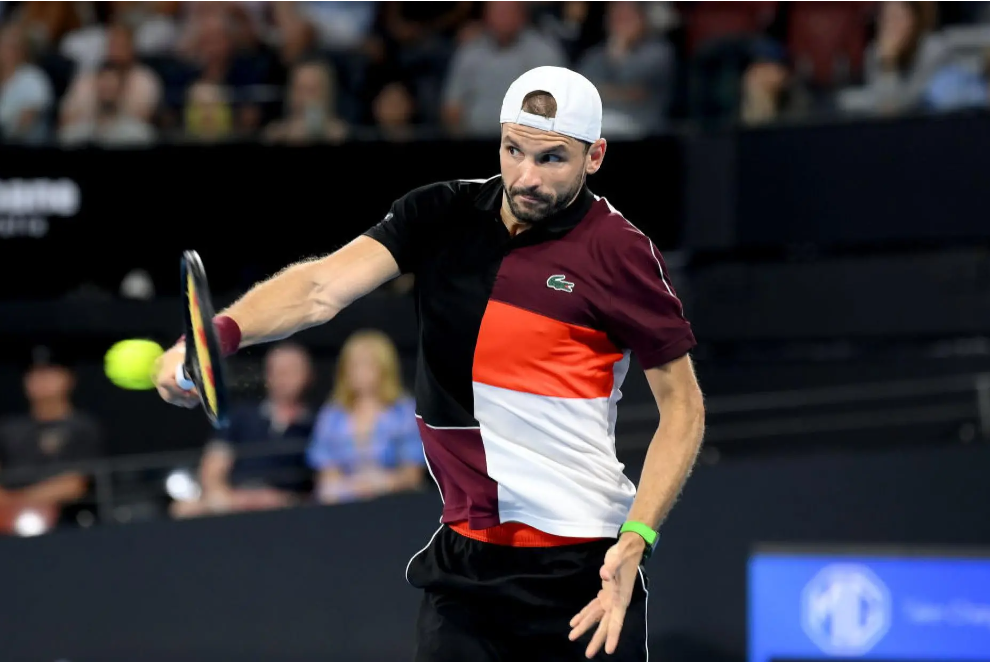
Grigor Dimitrov. Credit: Bradley Kanaris / Getty

Grigor Dimitrov was long known as “Baby Fed,” but yesterday, Holger Rune was the one trying to do a Roger Federer impression. Facing break point at 3-all in the second set, Rune kicked a second serve wide, got a cross-court slice reply, then ran around his backhand to smack an inside-in forehand: a high-risk, high-reward shot, especially if you aim for the line. Rune went big and he pulled it wide. That was the only break of the match.

The 20-year-old had already missed one of those in the same game: The first error dug him a 15-40 hole. Over the course of the match, he attempted seven inside-in forehands, a shot that usually wins him two out of three points. Against Dimitrov, he blew four of them.

The errors are a symptom of one of something separating Rune from the top of the game. In his eagerness to maintain an aggressive position at the baseline–a willingness that defines his style and, in fairness, often pays off–he tries a bit too hard. He swings to end points in three shots that probably need to go five. He keeps a toe on the baseline when he ought to be one step further back.

This isn’t a secret, and Dimitrov exploited it. The Bulgarian landed 82% of his returns behind the service line, compared to a tour average of 70%. 39% of Dimitrov’s returns fell in the back quarter of the court, beating the 28% that players typically face. In rallies, the veteran kept pummeling Rune’s feet, prioritizing depth over direction.

The strategy worked. Take the other pivotal juncture of the match, early in the first-set tiebreak. Serving at 0-1, Rune pushed Dimitrov off the court with an inside-out forehand, which came back as a deep slice. Nothing special, but as Rune stepped back to accommodate it, he hit an equally indifferent reply. Dimitrov came back with another middle-deep backhand and Rune hit the tape with as pedestrian an error as you’ll ever see. At 0-2, Rune’s plus-one forehand forced Dimitrov deep and set up the point for an easy finish–or so he thought. Dimitrov managed to get his defensive forehand deep enough that Rune stepped in–his back foot on the baseline–and the result was another miss that would leave a club player berating himself.

On both points, a slightly more conservative court position, or a better last-minute adjustment step, would have let Rune continue the rally with his opponent on the run. Most players tread more carefully in tiebreaks. Instead, he missed twice and fell to 0-3. He got one point back but couldn’t close the entire gap and lost the first set, 7-6(5).

Middle-deep mediocrity

Yesterday wasn’t the first time that Rune misreads a neutral opportunity as a chance to go big. His own-the-baseline strategy is a mixed bag, the best example of which is how he responds to service returns that land at his feet. The Match Charting Project codes every return by direction (cross-court, middle, or down-the-line) and by depth (shallow–in front of the service line, deep–behind it, or very deep–in the back quarter of the court). Dimitrov placed 13 of his returns in the middle-deep region, and Rune saved just 5 of those points.

When a return lands middle-deep, the point is fully up for grabs. Counting both first- and second-serve points, the server wins roughly 49% of the time from that position. (Once a deep return is in play, any lingering effect of a big serve is mostly erased.) A top player should do better, but Rune does not. Here are the career outcomes of those points for the current ATP top four, plus the two Brisbane finalists:

Player             W/FE%   UFE%  PtsWon%  
Novak Djokovic      6.8%   7.1%    53.8%  
Jannik Sinner       5.7%   6.0%    51.6%  
Daniil Medvedev     5.3%   5.9%    50.6%  
Carlos Alcaraz      8.0%   6.2%    50.1%  
Grigor Dimitrov     9.6%   7.9%    49.6%  
--Average--         7.4%   8.7%    48.9%  
Holger Rune        11.5%  10.9%    48.0% 

Rune is much more aggressive than his peers in these situations. It may feel like it pays off, since he ends more points with winners (or forced errors) than unforced errors. But the bottom line tells another story: He wins fewer points than average, and trails the best players in the game by a sizeable margin. As Djokovic, Sinner, and Medvedev can tell you, from a neutral position, immediate outcomes don’t matter as much as point construction.

It’s the same story later in the rally. Dimitrov won those two crucial tiebreak points by putting his second shot near the baseline. The serve return isn’t unique: Any stroke that lands in the middle-deep region turns the point into a 50-50 proposition. The above table showed how players fare from that position on the plus-one shot. Here are the numbers for everything after that:

Player           Winner%   UFE%  PtsWon%  
Carlos Alcaraz      8.2%  12.8%    55.3%  
Grigor Dimitrov     6.6%   6.3%    54.7%  
Novak Djokovic      6.2%   8.0%    54.6%  
Jannik Sinner       7.2%  10.5%    52.3%  
Daniil Medvedev     4.7%   6.8%    52.0%  
--Average--         7.1%  10.2%    49.3%  
Holger Rune         9.4%   9.7%    49.0%

The order changes, and Rune’s aggression doesn’t stand out like it does earlier in the rally. But the message is the same, only with a wider margin. Given the mix of players represented in the Match Charting Project, “average” is better than tour average, but it’s still a number Rune needs to surpass.

The second table, finally, brings us back to Dimitrov. If he hadn’t played yesterday, I wouldn’t have thought to include him on the list with the top four, but in this type of situation–one that demands both patience and tactical soundness–he rates with the best in the game.

Faced with an over-aggressive, slightly erratic opponent, the 32-year-old took advantage and turned in a workmanlike performance. That isn’t a dig: Dimitrov didn’t need fireworks, just steadiness. By my count, he racked up just 10 unforced errors to Rune’s 29, and just one of them–serving for 4-0 in the tiebreak–came a critical moment. It’s nothing so flashy as the “Baby Fed” moniker once promised, but Dimitrov’s mature game has gotten him up to 7th place on the Elo list, and a return to the official top ten is not far away.

* * *

Subscribe to the blog to receive each new post by email:
 

Angelique Kerber in the New World

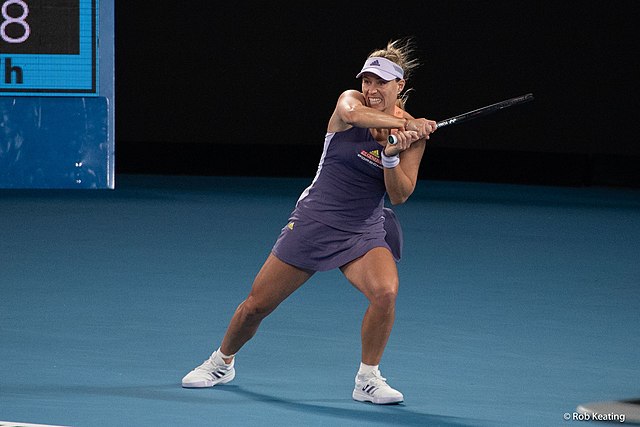
Angelique Kerber in 2020. Credit: Rob Keating

Angelique Kerber’s return to the tour has, so far, been a rocky one. She began Germany’s United Cup campaign with a narrow defeat to Jasmine Paolini, in which the Italian earned 21 break points against the German’s serve. Kerber took a set from the free-swinging Caroline Garcia but lost in three. Today, Maria Sakkari blew her off the court, winning nine games in a row before Kerber got on the board and split the remaining six.

The United Cup, in its new design, is not an easy place to make a comeback: The German faced top-30 players all three rounds. (Compare that to the tour event in Brisbane, where fellow returnee Naomi Osaka scored an opening-round victory against a player ranked 83rd.) Kerber surely didn’t expect to dominate immediately. It’s hard to get rolling again after an 18-month layoff, and she hasn’t been a truly elite player since early 2019. She turns 36 years old this month, a tough age even for players with three majors to their credit.

The Garcia match, in particular, highlighted another dimension of the challenge. The tour that Kerber rejoins is different from the one where she collected so many laurels. Angie is the very definition of a counterpuncher, a clever defender who uses anticipation and racket control to convert her opponent’s pace into winners of her own. It’s tough to counterpunch against someone like Garcia, who aims to end the point with nearly every shot.

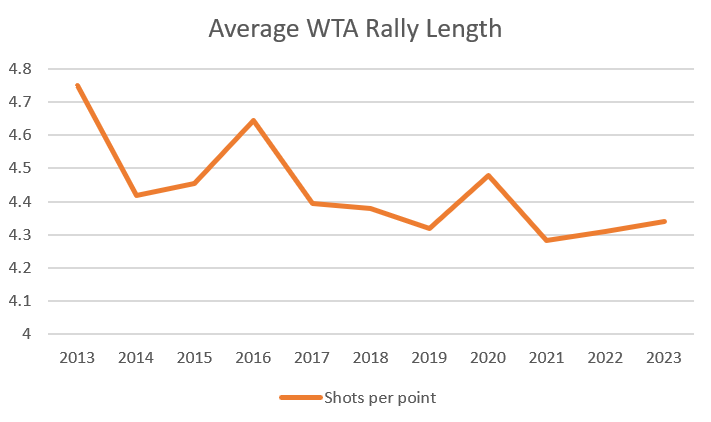
The reckless Frenchwoman is hardly alone. Based on data from the Match Charting Project, here is the average rally length on the WTA tour since 2013:

It looks a bit fluky, but it’s noteworthy to find a peak in 2016, Kerber’s best year. Rally length has been essentially flat since 2021, perhaps since 2019 if we set aside the Covid-affected 2020 season. The German is plenty familiar with the landscape, having competed on tour until Wimbledon in 2022, but she developed her game back when the power of Serena Williams was an outlier. Now, Serena’s late-career bashing is the model for a new generation.

There are a number of ways to illustrate the trend. While the year-to-year differences are minor, the arrows all point in the same direction. In 2016, 49.6% of points were decided in three shots or less. Last year, it was 53.0%. (In 2021 and 2022, it was a bit higher still.) At Kerber’s peak, nearly 24% of points lasted at least seven strokes. Last year that figure had declined to 20.8%.

This is probably worse news for someone like Caroline Wozniacki than it is for Kerber. Woz keeps points alive and waits for errors, skills that Garcia (or Aryna Sabalenka, or Elena Rybakina, or dozens more players she might draw in the first round of the Australian Open) render meaningless. While Angie isn’t going to pile up aces–she’s hit a grand total of two in three United Cup matches–she is fully capable of redirecting a serve for a return winner, as she did a couple of times against Sakkari. Still, the shorter the point, the less likely that Kerber finds an opportunity to work her magic.

Throughout her career, the German lefty has rarely had a problem picking spots to end points with winners or forced errors. Match Charting data shows that 6% of her groundstrokes go for winners, right in line with tour average.

The catch, though, is when she hits them. Kerber is one of 58 players for whom the Match Charting Project has recorded at least 2,000 winners and forced errors since 2013. Only four of those players unleash their winners later in the rally. The average shot number of Kerber’s point-enders is 4.9–bad news in an era when nearly two-thirds of points are finished in four shots or less.

Here are the twelve players in the dataset whose winners occur latest in the rally:

Player                Avg Winner Shot#  
Daria Kasatkina                    5.1  
Viktorija Golubic                  5.0  
Yulia Putintseva                   5.0  
Carla Suarez Navarro               4.9  
Angelique Kerber                   4.9  
Sloane Stephens                    4.9  
Agnieszka Radwanska                4.9  
Simona Halep                       4.8  
Svetlana Kuznetsova                4.7  
Anastasija Sevastova               4.6  
Caroline Wozniacki                 4.6  
Su Wei Hsieh                       4.6

This isn’t a table where you want to find your name north of Wozniacki’s. It’s possible to survive on today’s tour playing this way, as Daria Kasatkina has proven, but it is much less likely to translate into a major title. Wimbledon champ Marketa Vondrousova didn’t miss the list by much, coming in at 4.4, but her aggression varies wildly from one match to another. Iga Swiatek and Coco Gauff appear closer to the middle of the pack, at 4.2, and Aryna Sabalenka ranks as the fourth most aggressive of the 58, at 3.4.

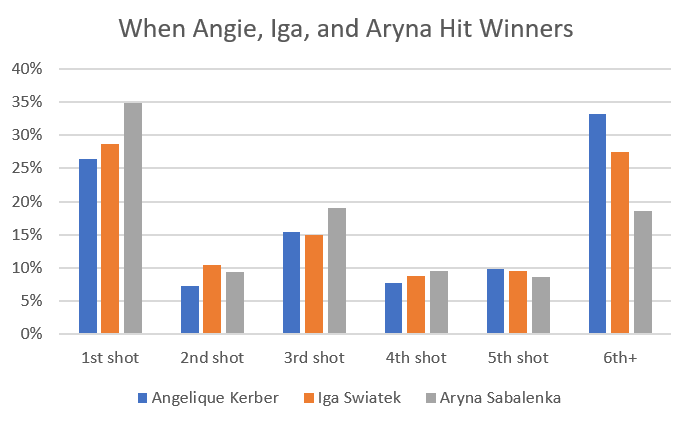
At the risk of belaboring the point, here’s another way of seeing the difference between Angie’s style and the brands of tennis that currently top the rankings. The following chart shows what percent of Kerber’s winners (and forced errors) happen at each point in the rally, compared to the same figures for Swiatek and Sabalenka:

The “1st shot” and “6th+” columns are virtual mirror images of each other. Even that understates the difference between the veteran and the two youngsters, because a point-ending serve from Kerber is more likely to be at least partially the fault of the returner–those errors are conventionally scored as forced regardless of the strength of the serve.

I don’t want to say that Kerber can’t succeed on her return to the circuit, but it’s clear that she faces a challenge. The tennis world of the mid-2010s is long gone, and even if she regains the form that took her to number one in 2016, it may not give her the same results in 2024. A new era requires a new Angie; we’ll see if she can produce one.

* * *

Subscribe to the blog to receive each new post by email:
 

How Coco Gauff’s Defense Won the US Open Final

Defense, as they say, wins championships. Coco Gauff has a big serve, a strong backhand, and a high tennis IQ, not to mention a new guru in Brad Gilbert. All of that got her to the US Open final and gave her a shot against new No. 1 Aryna Sablenka. But defense was what won her the match.

If you watched the final, you already know this. Over and over again, Gauff rescued a sure winner, hanging in the point long enough for Sabalenka to miss. In a close contest, as this one was, a handful of points can determine the result.

It’s tough to say exactly how many points Gauff saved with her exemplary defense. Sometimes she made multiple digs in the same point; other times she averted disaster just to lose the point a couple of strokes later. Still, we should try to quantify the effect she had on the normally imperious Sabalenka game.

My stat of choice is something I’m going to call, simply, Defense. For any match with charting-based stats, it’s a simple calculation: The percentage of the opponent’s groundstrokes that resulted in winners or forced errors. (I introduced it in my Andy Murray essay as part of the Tennis 128 project last year.) In other words: How often does the player get herself in a position to put a groundstroke back in play?

Among tour regulars on hard and grass courts, the range of the Defense stat runs from about 7%–the backboards that are Lesia Tsurenko and Sloane Stephens–to 15%, where you’ll find the less nimble Evgeniya Rodina and Linda Noskova. Lower is better! Tour average is around 11%. Gauff, over the course of her young career, has averaged 10.8%.

Average doesn’t carry much weight, though, when it comes to Sabalenka. Aryna’s groundstrokes end the point in her favor–with a winner or forced error–17.3% of the time. Only Jelena Ostapenko, at 18.0%, scores higher, and just a few other women are as high as 15%. Turning in an “average” performance against Sabalenka–that is, keeping her to 11%–is a massive step toward victory.

On Saturday, Gauff held her to 9.8%.

Sabalenka hit 285 groundstrokes in the final. 15 went for winners; another 13 turned into forced errors. Had she converted at her usual rate, those numbers would’ve been nearly twice as high: 49 points won off the ground instead of 28.

Gauff’s actual margin of victory was a mere seven points. By the Defense measure, she saved 21 solely with her superlative handling of Aryna’s groundstrokes. Again, it doesn’t quite work that way; she dug out multiple would-be winners on some points, for instance. On the other hand, it isn’t the only way Coco salvaged desperate situations. This measure doesn’t take into account quick-footed service returns or defense against the smash.

It’s almost impossible to overemphasize the magnitude of Gauff’s achievement. In 48 hard and grass court matches since last year’s US Open, just two of Sabalenka’s opponents managed a Defense stat better than 11.6%. The only other exception was Veronika Kudermetova, against Aryna’s limp performance in Berlin. Sabalenka’s average over the last 52 weeks is 19.7%, probably one of the highest marks posted by any baseliner, ever.

Gauff simply cut it in half. She effectively turned one of the most imposing players in women’s tennis history into a frustrated journeywoman–or at least the statistical equivalent of one. Gilbert might call it Winning Ugly, but it looked awfully good to me.

* * *

Subscribe to the blog to receive each new post by email:
 

10,000 Charted Matches

The Tennis 128 will return tomorrow with player #89.

* * *

I introduced the Match Charting Project to the world in November 2013. I had no idea whether it would ever draw the interest of anyone outside of a tiny group of tennis-obsessed friends. I was okay with that. The project was designed to be valuable even if we only ended up charting a few matches.

Eight and a half years later, that group of tennis obsessives has grown. Over 140 of you have learned my detailed charting notation and worked through an entire match. A dozen of you have logged every shot of 100 matches or more. One indefatigable contributor, Edo, is now over 1,300 matches. Another super-charter, Zindaras, is also closing in on four digits.

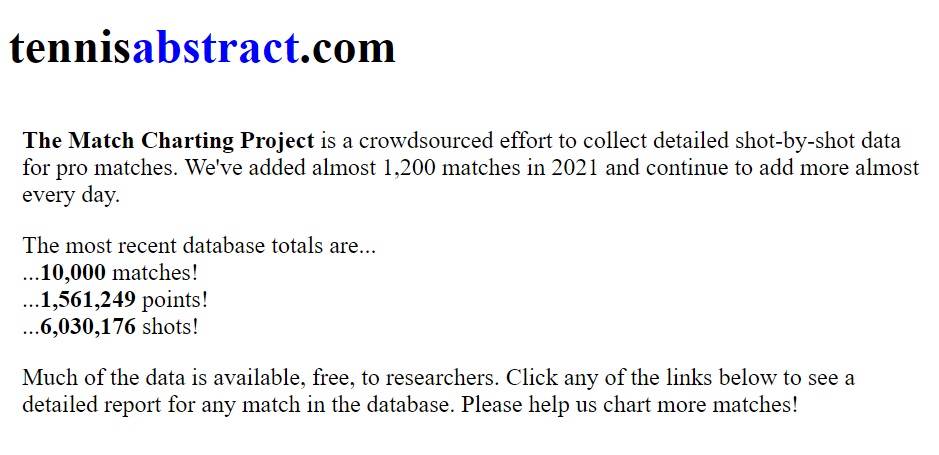
Yesterday, another all-star contributor, Ludo, sent in charts of two John Isner matches. They were the 9,999th and 10,000th charts for the project. We’ve logged six million shots, over one and a half million points, and yes, ten thousand matches. The 10,001st chart appeared in my inbox as I was writing this post.

* * *

Ten thousand matches is hardly a complete record of professional tennis, but it gives us a remarkably detailed view of both the men’s and women’s game.

In the last few years, we’ve come close to finishing many ongoing sub-projects. We have a chart for every grand slam final back to 1980, and many from the 1970s. We have most grand slam semi-finals back to the mid-1980s. We have nearly every Masters 1000 final back to 1990, when the Masters series began, and we have most Masters semi-finals in that span as well.

We’ve charted every match between members of the Big Four. We have almost every tour-level final ever played by the Big Four. We’ve collected charts of the major WTA events back to the 1990s, and we’ve racked up dozens of Evert-Navratilova matches before that. More recently, we’ve charted every single tour-level final (and a fair number of challengers and ITFs) from the last several years.

We have a shot-by-shot log of nearly every point Simona Halep has played back to the birth of the project, and near-complete sets of Aryna Sabalenka and Bianca Andreescu matches. We have charts of 543 Roger Federer matches, and over 400 each for Novak Djokovic and Rafael Nadal. We’ve charted at least ten matches for most players who have reached the men’s or women’s top 50 in recent memory. We have one hundred matches or more for 34 different players, and we’ll add Iga Swiatek and Diego Schwartzman to that list any day now.

You can always check in on the state of the project, along with a full list of charted matches, here. Raw data from more than half of the charts is available for research purposes and updated monthly, here.

* * *

The best part about this project, to me, is that there is value in every single contribution. It may feel like a drop in the ocean to submit, say, the 544th Federer chart, but even that gives us a fuller historical record of Fed’s career and a more detailed statistical summary of his performance that season–not to mention more data on his opponent. If you’re more interested in breaking new ground, there are always interesting young players who are barely represented in the dataset.

Most of all, it’s fun–at least for the right kind of person. Maybe you think it’s bonkers that some of us enjoy typing alphanumerical codes into a spreadsheet as we watch tennis. Put it that way and … well, I get it. But once you get the hang of charting, it forces you pay more attention and learn more about this endlessly complex sport. While watching tennis. Which I suspect you enjoy quite a bit.

Learn how to get started here. I hope you’ll contribute as we march on to the next 10,000 matches.

Podcast Episode 93: ESPN’s Bill Connelly on What Novak Djokovic Does Better

Episode 93 of the Tennis Abstract Podcast welcomes Bill Connelly, who wrote about Novak Djokovic this week at ESPN. You might know Bill from his coverage of soccer and college football, including his two books, Study Hall and The 50 Best* College Football Teams of All Time.

Bill, who dug into Match Charting Project data for his piece, explains how Djokovic tactically differs from the competition, how his game has changed over the years, and whether the nature of his game makes it tough to fully appreciate. I also encourage him to speculate about whether Novak will reach 20 slams, and if that would make him the greatest of all time.

Also on the agenda: whether tour-wide parity is better than dominance, how ESPN (and tennis media in general) could cover the sport differently, and why there are so few people who love both tennis and college football.

Thanks for listening!

(Note: this week’s episode is about 48 minutes long; in some browsers the audio player may display a different length. Sorry about that!

Click to listen, subscribe on iTunes, or use our feed to get updates on your favorite podcast software.

Podcast housekeeping:

  • In case you haven’t heard, I’m now doing a short (~4 minutes) daily podcast called Expected Points. Here’s today’s episode.
  • The TAP book club will reconvene in a few weeks with our next selection, John Updike’s 1968 novel, Couples. Read along with us, share your thoughts, and suggest topics/questions/comments for our discussion in a future episode.
  • Fans of the TA podcast will also want to check out Dangerous Exponents, Carl’s and my Covid-19 podcast. This week, we talked about the Russian, Chinese, and Indian vaccines.

The Underhand Serve: When and Why?

An underhand serve functions in two ways–one short term, one long term. The short-term goal is to win a single point. Your opponent is standing way back, and the service equivalent of a drop shot could go for a 50 mile-per-hour ace. The long-term goal is to give your opponent something to worry about, perhaps distracting him or changing his return position for games, or sets to come. It’s not about winning a single point, but about slightly improving your odds in many future points.

In his second-round match yesterday against Ugo Humbert at the Australian Open, Nick Kyrgios opted for both. He unleashed the underhander twice, once at 40-love in his second service game, and again at 5-5, 40-30 in the fourth set.

The first dropper was on as meaningless a point as he could ask for. Kyrgios’s probability of winning a service game from 40-love is about 99.6% (really!), so the risk of losing the game after throwing away a point is essentially nil. He won the point with a backhand winner on his next shot, but the object of the exercise–assuming there was a tactical one, and I’ll give Nick the benefit of the doubt here–was more long-term oriented.

He delivered the second underarm serve on a much higher-pressure point. Kyrgios is still heavily favored to hold serve from 40-30, but he could be forgiven for feeling some nerves and wishing for a free point. This time he netted the underhand attempt and ended up winning the point after a (conventional) second serve.

A drop of data

When the underhand serve first started to go mainstream a couple of years ago, I updated the Match Charting Project spreadsheet to allow us to track these attempts. Counting the Kyrgios-Humbert match, we’ve now gathered the results of 35 drop-serve attempts across 20 different men’s matches. (We’ve recorded many women’s underhand serves as well, but most of those belong to Sara Errani, who has a different set of goals when she goes that route.)

35 points is awfully far from big data, but it is enough to get a taste of how a handful of players are deploying this unorthodox weapon.

The most common point score for an underarm serve is 40-love. Of the 35 attempts, 40-love accounts for 12 of them. Another 4 occured at 40-15, plus two more at 30-love, so roughly half of the recorded drop serves came with a service game more or less secured. A few of the remaining points were also relatively unimportant ones, like Daniil Medvedev’s underhander at love-40 toward the end of a 2019 US Open match against Hugo Dellien, and Alexander Bublik’s back-to-back tries at 0-5 and 1-5 in a tiebreak against John Isner.

Bublik is the major source of unimportant-point underarm serving. He’s responsible for 19 of the recorded points, 16 of which were at 40-love, 40-15, 30-love, or those two tiebreak points I just mentioned.

Inferring tactics

Since so many underarm serves are deployed at low-pressure moments, it’s tempting to conclude that players are thinking long term.

On the other hand, our handful of recorded underhand deliveries–even the ones on 40-love points–don’t skew toward the beginning of matches. We have two charted matches in which Robin Haase tried an underhander: a 2019 Budapest tilt against Borna Coric in which he made his first attempt in the third game, and a 2020 Davis Cup rubber when he waited until the 32nd game of the match.

Poster boy Bublik is inconsistent on this as well. Twice he has brought out the underhander in his second service game–once in the Newport match versus Isner, and another time the same summer in Washington against Bradley Klahn. Yet at the US Open against Thomas Fabbiano the same year, he didn’t unleash the secret weapon until 40-love in the 32nd game of the match.

I’ll admit, it might be foolish to try to detect the grand plan underlying the behavior of Alexander Bublik.

But it works!

Yeah, our 35 points make up tiny sample, but… the server won 27 of these 35 points! That’s 77%, and it includes underarm first-serve attempts that missed. When players had to hit a conventional second serve, they still won 7 of 10 points–a rate of second serve points won that any player would happily accept.

These numbers–cautiously as we must treat them–suggest that the underarm serve trend has plenty of room to run. The rare players who dare to risk ridicule are still only using the drop serve less than twice per match, and of course the vast majority of men on tour are never hitting them at all. The more common the underhand delivery becomes, the less effective it will be, but there’s a lot of space between the current drop-serve win percentage of 77% and the typical player’s success rate on serve. Tour average is around 65%, and only the most dominant servers exceed 70%.

As Bublik and friends have discovered, there’s little risk in mixing things up. Strong servers like him and Kyrgios have plenty of low-leverage opportunities to remind their opponents that surprises could be in store later in the match, when the stakes are raised. Our very early indicators suggest that where Kyrgios has gone, the rest of the tour could profitably follow.

Charting Aryna Sabalenka’s Win Streak

Aryna Sabalenka has won 3 titles and 14 matches in a row. Let’s dig into the data and see if we can identify any improvements that would account for her success.

For the Match Charting Project, I’ve logged every shot of each of the Belarussian’s tour-level matches. (There are a few exceptions where I haven’t found video.) We’ll look at hard-court matches only today. With that constraint, we have 140 Sabalenka matches, dating back to early 2017 (including the current streak), and another 1,121 women’s tour-level contests over the same time period for reference.

Big serving?

Aryna always brings a powerful serve, but it remains a work in progress, at least tactically. The key metric for pure serve dominance is unreturned serves–quite simply, serves that don’t come back. While some are aces, they don’t have to be, and the distinction doesn’t really matter.

This first graph has a lot going on, but as I’ll use the same basic template for several more figures, it’s worth taking a moment to understand what we’re looking at. The two dotted lines show tour average rates of unreturned serves (the lower average is for all players; the higher one is for match winners), the thin jagged line shows Sabalenka’s rate of unreturned serves for each individual match, and the thicker red line shows her five-match rolling average.

Her five-match rolling average has been above 30% for the entire win streak. It’s not an unprecedented level for her, though–she sustained similarly high levels at various points over the last three years. (We should also be a bit cautious ascribing serve effectiveness to a player when the Ostrava, Linz, and Abu Dhabi courts might have been faster than average.) Consistently powerful serving has certainly helped Sabalenka’s cause, but it probably isn’t the whole story.

We might gain from breaking down Aryna’s serve effectiveness into first and second serves. First, let’s look at something else:

Serve plus one

There are two ways we could look at “serve plus one” effectiveness, and we’ll do both. First, let’s count Sabalenka’s opportunities to hit a second shot behind her serve, and see what percentage she puts away. (As with aces and other unreturned serves, the “winner” concept is a distraction: I’m counting second-shot winners together with shots that force errors. If you end the point, it doesn’t matter much whether your opponent touches the ball.)

The second figure shows us that, on hard courts, when women are faced with a second shot behind their serve, they finish the point about 20% of the time. Sabalenka’s career average is 28%. She far exceeded that over a string of four matches to finish Ostrava and start Linz, maxing out at 42% against Jennifer Brady in the Ostrava semi-final. Since then, her rate returned to roughly her (impressive) career average.

This measure is something of a “key to the match” for Sabalenka. When she converts at least 30% of second-shot opportunities behind her serve, she wins 91% of her matches. When she doesn’t, she wins 62%. Of course, 62% is nothing to be ashamed of, and the dip visible in early 2020 coincides with her Doha title, the one time in her career that the five-match rolling average fell below 20%.

Serve plus serve plus one

These first two measures are related, of course. A big server should post good numbers in both. But a great “pure” serving day might mean a worse-looking serve-plus-one day, because fewer weak returns are coming back at all. The reverse holds as well: A strong server might not hit as many unreturned serves as usual because her opponent is managing to just barely put them back in play–easy sitters for second shots.

To identify the combined benefits of good serving and efficient serve-plus-one’ing, we simply count how often Sabalenka wins service points in two shots or less.

We’ve already seen the two components of this, so there are no surprises here. The typical player wins about 40% of her service points this way, and Aryna has historically averaged 46% on hard courts. This number looks as good for her recent winning streak as we’d expect. But as with the previous graph, it suggests weakness during her 2020 Doha title, so the predictive power here is limited.

First and second serves

The combined metric of unreturned serves plus second-shot putaways gives us a good snapshot of when the offensive game is working. Let’s break down the previous graph into first- and second-serve specific numbers:

These track the overall numbers. Aryna has generally been good lately on both first and second serves, but with neither one has she been more successful or consistent than in previous hot streaks. Second serves are particularly hard to rate because the per-match sample size is so small–fewer than 30 second serve points per player per match, and some of those end up as double faults.

Before moving on to the return game, let’s look at one more indicator of service-point success:

Longer points on serve

As I said at the outset, Sabalenka has always been a good server. While her current momentum might owe a bit to fewer mental lapses on serve, it would be logical to look elsewhere for an explanation, simply because there was more room to improve in other areas.

We’ve seen how her serve and second shot rate. What about serve points that go deeper? This metric considers all points where the returner’s second shot comes back, and then counts how often the server goes on to win the point.

The average hard-court WTA match winner claims almost exactly half of her service points when the rally reaches five shots. Over her career, Sabalenka has won 48%, worse than the typical match winner but better than the overall tour average.

Aryna has done better lately. To cherry-pick a starting point, she has won 51% of these points in her last 24 matches, dating back to the Doha second round. Her average over the first five matches in Abu Dhabi was 55%, the best she has managed since her breakout run in late 2018, when she pushed Naomi Osaka to three sets at the US Open and hoisted the Wuhan trophy a few weeks later.

Return winners

We’ll walk through the dimensions of her return performance in a similar manner, starting with return winners (and point-ending non-winners), then on to “return-plus-one” putaways, followed by the combination of the two.

First, return winners. I use the number of point-ending return winners divided by in-play serves–that is, excluding double faults.

Veronika Kudermetova had a rough day last Wednesday, so Sabalenka’s current five-match rolling average is as high as it’s been since early 2018. Apart from that last-minute burst of return dominance, her recent return winner rates look a bit like the serve stats: consistently solid, if not spectacular.

Return plus one

How about when the serve return doesn’t finish the job? This “return plus one” metric counts opportunities when the server puts her second shot in play and measures how often the returner hits a winner or forces an error with her own second shot. The sample sizes are a getting a bit small here (each player has 43 such opportunities in an average hard-court match), so the per-match rates are rather spiky:

The small single-match samples, combined with the relationship between return-plus-one and return winners–almost interchangeable ways to respond successfully to a mediocre serve–render conclusions a bit tough to come by. Sabalenka was average by this measure in Ostrava, great in Linz, and all over the place in Abu Dhabi.

Short return points won

Will things be clearer when we combine both methods of quickly winning a return point?

Aside from a weak return performance against Elena Rybakina in Abu Dhabi, Sabalenka has been comfortably above average in this metric in every match since she faced Victoria Azarenka in the Ostrava final.

Like “serve plus one,” this is a good indicator of overall success for the Belarussian. If we use this metric to split her 140 charted hard-court matches in half, the dividing line is 27.5% of return points won with a return winner or a return-plus-one putaway. Above that mark, she has won 62 matches, or 88.6%. Below it, she has won only 41, or 58.6%. She was above the line in nearly all of her matches in Linz and Abu Dhabi, and she sat at 25% or higher in every round of her 2020 Doha triumph, clearing 30% in three of five matches there.

First and second serve returns

Has she been particularly devastating against first or second serves? Let’s see:

Few women feast on second serves the way Sabalenka does, and she’s been particularly relentless of late. The typical tour player wins about 30% of second-serve return points with a first- or second-shot putaway, and over her last 15 matches, Aryna has won 41% that way. 41% is a respectable total percentage of return points won against many servers, and Sablaenka would be winning that many even if she refused to hit more than two shots per rally.

Granted, Sabalenka doesn’t hit that many fifth or sixth shots. How does she fare when her return points extend that far?

Long return points

You’ll be glad to know that the code for this final* graph didn’t throw any divide-by-zero errors–Aryna has played at least one “long” return point in each of her hard-court matches. This metric tallies up all return points in which the server puts her third shot in play, then calculates how often the returner won the point.

** Yes! It’ll be over soon!

This is another spiky mess, with an average of only 20 points per match. Still, if we’re looking for a category in which Sabalenka is newly excelling–not just thriving as usual–this could be our smoking gun.

Tour average for match winners on this stat is 46.7%. The server has an advantage by definition, because she has just put the ball back in play. The Belarussian’s career mark is 44.4%, only a bit better than the overall average. Yet in her last 15 matches, she has won 48.0% of these long return points, her best 15-match span since early in her career, when she faced a weaker mix of opponents.

I don’t want to overemphasize this: When there are only 20 points of this type per match, an improvement of 3.6 percentage points translates to a gain of less than one point per match. That doesn’t explain the magnitude of Sabalenka’s recent gains. But it does indicate that she is shoring up one of her few weaknesses, and in combination with her solid play on long serve points, it suggests that she no longer needs to rely on a one-two punch, even if her one-two punch is as dizzying as anyone’s.

Don’t make me say consistency

Tennis matches are decided by a handful of points: While Sabalenka has been dominant lately, she lost more points than she won against Coco Gauff in the Ostrava opening round. As such, improvements always look minor when we try to quantify them, if we can quantify them at all.

I’ve pointed out some areas where Sabalenka may be improving, others where a good statistical showing usually coincides with a W, and still others where an excellent performance doesn’t seem to matter much. All of these categories have one thing in common: She is putting up stellar numbers right now.

Remember, in the twelve graphs above (yes, twelve, sheesh), the dotted yellow lines indicate the average performance of match winners. In every single one of the categories, Aryna’s five-match rolling average is above that line. Every single one! In most cases, it has been above the line for some time.

It doesn’t take any statistical savvy to see that if a player is better than the average match winner in every category, she’ll be awfully tough to beat. The rest of the Australian Open field can only cross their fingers that Sabalenka’s current form won’t survive two weeks of quarantine.