Here are just a few milestones we’ve hit recently:
17,000 charted matches
10,000,000 (yes, ten million) charted shots
1,000 different women with at least one charted match (we reached the same number of men last year)
2025 was the most productive year yet for the project. For the second year running, we added more than 2,000 matches. More than 1,400 of them were from the 2025 season itself, meaning that we kept the database up-to-date in close to real time.
Do the math, and you’ll see that we boosted the historical data, as well. 2025 brought in nearly 800 matches from previous seasons. While we long ago finished up the biggest matches of the past (slam finals and semi-finals, masters finals, big-four meetings, etc.), we’re continuing to flesh out the 30-plus years before the start of the project. Contributors dug into the archives and charted dozens of tour-level finals, second-week slam matches, and consequential Davis Cup rubbers.
Of all the stats I could cite to illustrate the MCP’s progress, my favorite is that 2025 saw more contributors than any previous year. 32 different people charted matches. Three contributors (plus yours truly) have crossed the 1,000-match mark, with one more likely to do so in the next few weeks. Another dedicated contributor has already submitted 300 matches despite getting started barely one year ago.
You can help, too. 1,400 current-year matches sounds like a lot–it is a lot!–but it is only represents about one-quarter of tour-level contests. (Plus, we do ITFs and Challengers!) We have Sabalenka, Swiatek, Alcaraz, Sinner and a few other personal favorites pretty well covered, but there’s always a need to deepen our coverage of the rest of the tour.
Here’s the Quick Start Guide. Charting isn’t for everybody, and it takes a little time and effort to learn. Still, you might be one of the select few to discover that you love it.
The benefits accrue to the entire tennis community. In addition to the detailed match reports (like this one for the Sincaraz US Open final), the Tennis Abstract site has detailed charting data on every player page (here’s Mirra) and leaderboards full of stats you won’t find anywhere else.
Much of the raw data is available, as well. The MCP is one of the most underrated, underused tennis datasets. Like charting itself, it’s complicated: Making sense of shot-by-shot data is tricky business, even before you write your first line of code. But if you want to go beyond aces, break points, and Elo ratings, this is where you’ll end up. A ton of the research on this blog is powered by MCP data, and I always feel like I ought to do more.
Here’s to an even better 2026 full of charts both epic and obscure. I hope you’ll join us.
Four years ago, when I started work on the Tennis 128, Carlos Alcaraz was 18 years old. He was ranked 32nd on the ATP computer. Now, six(!) major titles later, I’m officially adding him to my pantheon of greats.
The algorithm I devised for the Tennis 128 was designed to measure entire careers, so it takes a herculean effort someone so young to make the cut. Since a 22-year-old can’t yet amass impressive career stats, the key is to achieve a historically great peak. That was Jannik Sinner’s path onto the list last year. Alcaraz climbed nearly as high, flirting with the 2300-Elo threshold after his US Open title this year.
With that newly-established level and one more season at the top of the game, Alcaraz debuts on the list at #83, displacing a couple of Australians, Jack Crawford and Lleyton Hewitt.
(As in the past, I’m not going to kick anybody out, so the Tennis “128” is up to 132 members.)
The Spaniard is the only big mover on the list this time around. The algorithm has three components: peak Elo, year-end Elo for a player’s five best seasons, and year-end Elo for the entirety of his or her career. Players can improve their lot by posting an additional great season, as Sinner did. But without bumping their peak Elo, there’s only so much one can do in a single season. In my view, that’s how it should be. This is, after all, a ranking of entire careers.
Three other young, active greats had already muscled their way onto the list, and all three saw modest gains in 2025:
Aryna Sabalenka won another major–among many other titles. Her run to the final in Riyadh even nudged her Elo up to a new career peak, if only slightly. She slides just past another big hitter, Petra Kvitova, to a new place at #105.
Jannik Sinnermatched Alcaraz blow for blow, often (almost) literally. While he didn’t improve on his peak Elo, he finished the year atop the list with another near-2300 showing. He moves up to #66.
Iga Swiatek is no longer as imperious as she was at her best. But she remains one of the top two players in the game. She gains two places to #91.
2026 might be the first year without any new additions to the list. Alexander Zverev and Daniil Medvedev have hovered within striking distance for a few years now, but without a significant step forward–say, a 50-point increase on their peak Elo ratings–they will likely remain on the outside looking in. No other active men are close.
Coco Gauff is probably the most likely next debutante, but she has even more ground to cover. Elo doesn’t rate the current era very highly. While the Tennis 128 does apply some modest era adjustments, a string of years at number three right now isn’t going to do the job. For Gauff to join the club twelve months from now, she’ll probably need a multi-slam, year-end-number-one season.
I wrote last week about the decline of specialization on the men’s tour. I proposed that we see more good all-around players because, as the overall level improves, there’s less relative value in being a one-dimensional servebot or dirtball grinder.
A few people responded–and I paraphrase, slightly: It’s the surfaces, stupid.
Everybody seems to agree that at some point, let’s say between peak Sampras and peak Djokovic, surface speeds converged. Hard courts got slower, and some grass courts got slower, too. Serve-and-volleying mostly disappeared, and grinding baseline play took over.
The only debate, it seems, is why. Was it a conspiracy to give the fans (well, all the fans except for the ones complaining) what they wanted? Is it the balls? The rackets? The strings?
I’ve always been skeptical of the conspiracy theory. More generally, I have been–and still am–skeptical that playing conditions have changed that much. Just because everybody believes something–even if those people are top-ranked players and well-respected pundits–doesn’t make it true. The historical record shows that styles have changed, but it’s much harder to marshal evidence that the surfaces themselves are meaningfully different than they were 20 or 30 years ago.
A quick review
I’ve looked at this stuff before. Here’s a quick summary:
The Mirage of Surface Speed Convergence (2013): I compared ace rates and break rates on hard and clay courts for pairs of players, 1991-2012. I found that the difference between hard courts and clay courts had, if anything, slightly widened, even though the conventional wisdom of convergence was fully in place by then.
The Grass is Slowing: Another Look at Surface Speed Convergence (2016): I wish I had named this differently, because I didn’t show that the grass slowed, I showed that rally lengths at Wimbledon (and to some extent at the hard-court slams) were converging with those at Roland Garros. It was my first stab at the problem using Match Charting Project data, which meant it used rally length, instead of ace and break rates. However, it relied on limited data, which meant there were heavy biases in which players it measured.
Surface Speed Convergence Revisited (2023): With more MCP data, I worked out a simple model of how much surface affected rally length, and how the effect had changed over time. Now without the selection bias, I showed that in both men’s and women’s tennis, the influence of surface on rally length had shrunk.
Pick your stat
To grossly oversimplify: If you look at ace rate, there’s no evidence of surface convergence. If you look at rally length, there is.
I didn’t want to rely on a 2013 mini-study for the ace-rate conclusion, so I came up with some new fodder.
My surface-speed ratings are based entirely on ace rate. Originally, this is because we don’t have better stats going very far back, while we do have ace rate for all ATP matches since 1991. The MCP has an increasing amount of coverage, but it is not complete, and the ace-based ratings have always seemed to capture surface-speed differences pretty well. There’s some noise, because there are only so many matches per tournament per year. But in general, they give us a pretty good idea of what’s going on.
The downside is that they are indexed to each year’s average. The rating for the 1991 edition of Wimbledon is 1.20, meaning that–controlling for the mix of players–there were 20% more aces than a 1991-average event. This year, Wimbledon’s rating was 1.12: 12% more aces than the 2025 average. But are those averages the same?
That question offers us a neat little experiment. Instead of indexing on a single-year average, why not do two years at a time? The pool of players was almost identical in 1992 as in 1991, so it’s a fair comparison. As it turns out, Wimbledon’s ace-based surface rating went down from 1.20 to 1.06 between 1991 and 1992. That kind of shift often happens due to randomness, but maybe it could be validated by a longer trend. Looking at two years at a time–1991 and 1992 together, 1992 and 1993 together, up to 2024 and 2025 together–allows us to make the same comparisons for the entire tour calendar, for a span of 35 years.
Well, in that span, ace rate has gone up quite a bit. And not just because mediocre servers have been replaced by better ones. On average, the same servers (against the same returners, though the returner effect is much smaller) have upped their ace rate about 2% every year. Not enough to notice as it happens, but enough to move the ATP tour average ace rate from below 7% in 1991 to a bit over 10% today. Some of the difference is due to the tournament mix–a shorter clay calendar, mostly. But I ran the same analysis on a core group of 15 events that have been in the same place since 1991, and the controlled-for-players increase is still 1.6% per year.
What about convergence, taken literally? Have faster events gotten slower, while slower events have sped up?
Nope! The variance between tournament ratings is almost exactly the same in 2024-25 as it was in 1991-92. An example: Back then, Wimbledon’s two-year average was 1.13, while Monte Carlo was 0.58. Over the last two years, Wimbledon’s rating has been 1.14, with Monte Carlo at 0.57.
It’s the strings…
How do we reconcile the evidence that ace rate has gone steadily up, while rally length has also increased?
Setting aside laboratory-type measurements (like CPI/CPR, which we don’t have far enough back, anyway), the purest way to measure court speed is ace rate. A slow court keeps the ball on the ground longer and slows down the rest of its trajectory. Returning is all about reaction time, and ace rate tells us whether returners physically got there or not. That’s why there are, reliably, so many more aces on hard and grass courts than on clay, and on faster hard courts than slower hard courts.
Now, it could be that players have gotten stronger, serve tactics have gotten less predictable, and racket/string technology allows servers to put the ball in the corner more often. All of that is probably true, so the 2%-per-year average likely overstates the change in surface. The ace increase might entirely be attributable to training and tech. But if you want to argue that surfaces have gotten slower, you’ve got an uphill battle to explain how aces have gone so far in the wrong direction.
The rally-length trend is easier to explain. Unlike ace rate, shots-per-point isn’t just about how the ball interacts with the surface. It’s about tactics and spin.
And actually, tactics are themselves largely about spin. And spin, well, that brings us to polyester strings.
Modern topspin is possible largely thanks to polyester strings. The best-known milestone is Gustavo Kuerten’s 1997 French Open title, the first major won with a Luxilon-strung racket. It took a few years for everybody to make the switch, but polyester string was kryptonite for serve-and-volleying. Now it was possible to hit returns that dipped to the server’s feet at the net. All that topspin also made it tougher to move forward. More topspin meant that deep groundstrokes were higher-percentage shots, and that opponents needed to give up even more ground to comfortably handle them.
When I wrote about Lleyton Hewitt a few years ago, I showed how Hewitt forced Roger Federer to basically give up serve-and-volleying. That was 2002-05. If it hadn’t been Hewitt, it would’ve been someone else–or everybody else.
Less serve-and-volleying, safer groundstrokes, fewer net approaches overall … all that adds up to longer rallies. No surface change necessary.
… and the youth
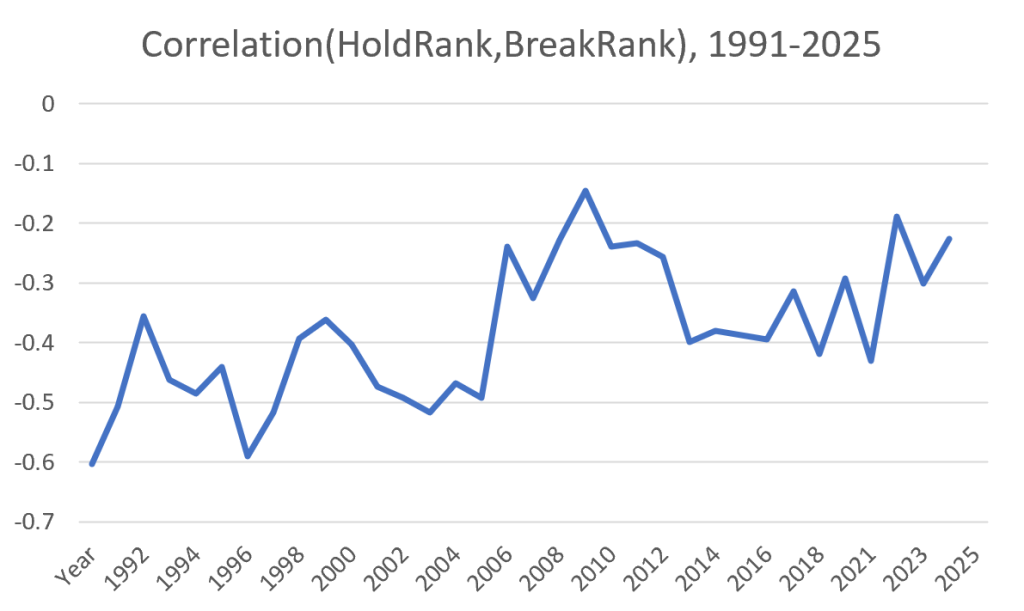
Let me show you the graph from my decline-of-specialization piece again. Generally speaking, it shows how much serve skill is related to return skill. Higher numbers (closer to zero) indicate a closer relationship, or in tennis terms: more all-around players.
Someone on Twitter reasonably asked, what’s up with the peak around 2008-2010? It’s a noisy graph, but a plausible interpretation is that it breaks down into two segments. Up to 2005, most of the data points are between -0.4 and -0.5, with a couple on either side. Since then, the line rarely dips below -0.3. (2013-16 leaves some explaining to do.) Accept this reading, and 2008-10 isn’t a stand-alone peak, it’s the solidification of a new era.
What else was going on in 2008-10? Novak Djokovic won his first slam, and Rafael Nadal established himself as an all-court force. In short, this is when people really started talking about surface speed convergence. Probably not a coincidence.
But why then? Well, in the spring of 1997, the tennis world figured out that polyester strings weren’t just the misguided side-hustle of a bra-strap company. Players with an eye on the future started to switch.
When Guga lifted his trophy, Nadal was 11 years old. Djokovic was 10.
The learning curve
Professional tennis is tough. Players like their gear. They’re used to their gear. It took years for Federer to give up his 90-square-inch frame. Sampras never did abandon his 85-square-incher. When a pro finally does switch, the benefits are hardly instantaneous. It might even mean a temporary step back.
The ultimate advantages go to the tech-natives. For all of Kuerten’s success with Luxilon, he was never going to wring the full benefit of the new technology and the tactics that it implied. If a certain racket/string setup is optimal, the players who do the most with it will be those who built their entire games around it. I don’t know whether the critical age is 8, 11, or 14 (maybe it helped Federer that he was a bit of a late bloomer), but it definitely isn’t 20 or 25.
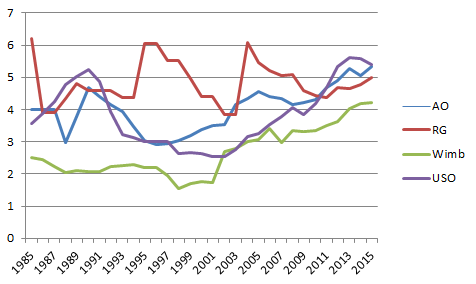
Check out the rally-length graph (based on slam finals) from my 2016 piece:
Wimbledon went from a low in 1998-2001 to a completely different level by 2006-08. Not a coincidence. The slam-finals graph tells the story of a select few guys, but by the late 2000’s, a whole generation of polyester natives–Djokovic, Nadal, Murray, Nalbandian, Berdych, Ferrer, Monfils–had taken over.
None of this requires the surfaces to change one iota. Maybe fans or tournament directors wanted longer rallies, maybe they didn’t. They were going to get baseline tennis no matter what.
Playing styles converged because topspin-powered strategy works across surfaces in a way that no previous style did. Rallies got longer because the players who tried to shorten them were stranded in the forecourt. They fumbled half-volleys into the net or watched passing shots as they whizzed by. Surfaces ended up as the scapegoat for a new era, but they didn’t cause it.
You might have heard that Jannik Sinner did something in 2025 that no one has ever done before. For the first time since modern statkeeping began in 1991, he led the tour in both hold percentage and return percentage. There’s a caveat here, because Sinner missed most of the clay season, which might have dragged down his return numbers relative to the field. Still, it’s a tremendous accomplishment.
Only a few players have ever come close. Novak Djokovic ranked first in hold percentage and third in break percentage in 2023, and Andre Agassi reversed those rankings in 1999. In 1995, Agassi had placed third in both categories. Only a handful of others–basically the Big Three–have ever cracked both top fives simultaneously.
We owe this whole framework to Cracked Racquets majordomo Alex Gruskin. He likes to talk about “clubs” of players who rank in the top 10, or top 25, or whatever, of both hold and break percentage. It’s a great way to quickly identify the best all-around players on tour. “Top 25” may not sound impressive, but this past year, only nine men made the cut. Doing so is a near guarantee of a top-ten finish. Only Casper Ruud (year-end #12) and Grigor Dimitrov (injured since Wimbledon) were top-25-clubbers without also finishing top ten in the rankings.
Sinner, then, is on another planet, and most players are lucky to sniff the top ten in one category, let alone both. That said, the number of all-around superstars is creeping upwards.
Three guys–Sinner, Djokovic, and Carlos Alcaraz–qualified for the top ten club this year. Jack Draper just missed, finishing 11th in break percentage. Excluding the 2020 Covid season, this is only the fifth time since 1991 that three men qualified. All but of those seasons have come since 2019. The most common number of top-ten-clubbers in a single year is one. There times in the 1990s, there were zero.
The story is similar regardless of the threshold. 2023 saw nine top-20 clubbers, the most ever. For the first fifteen years of ATP statkeeping, the average season delivered fewer top-25 finishers than that.
The trend is clearest when we boil it down to one number. For every season since 1991, I took the top 50 from the year-end rankings and worked out their positions on the hold and break percentage lists. This graph shows the correlation between hold ranking and break ranking for each campaign:
A correlation of zero would mean that there was no relationship between a player’s hold and break ranks; negative means that if someone is high in one category, they are more likely to be low in the other. Of course, it’s a matter of degree. Over time, the inverse relationship between serving and returning skill has eroded. We hit peak well-roundedness around 2010, and we appear to be back in a similar state of affairs.
Why?
This is where it gets interesting. (And, I’ll admit, rather speculative.)
In sports (and the economy in general), specialization tends to increase over time. We rarely see multi-sport athletes these days. NFL players once played both offense and defense; now specialists handle each side of the ball. Baseball teams once got through entire seasons with a handful of pitchers; now it can take as many arms to get through a single game. Specific skillsets are deployed to handle right-handers, left-handers, and the late innings.
This has happened in tennis, too, kind of. There has probably never been a better server than John Isner. Never a stronger returner than Novak Djokovic. Setting aside skills that have fallen into the background in today’s game (everything associated with net play), the best of every specific thing is on display now, or has been recently. This isn’t to say that Richard Gonzalez, or Ken Rosewall, or Ivan Lendl couldn’t have done it better. They just didn’t have the chance. Modern sports encourage early specialization. The whole ecosystem then delivers training, coaching, and equipment that yesterday’s greats never dreamed of.
But! Isner only (“only”) peaked at #8. Diego Schwartzman, who at his best rivaled Djokovic as the sport’s most brilliant returner, also topped out at #8. We all know why: Neither one was very good at the other half of the game, at least by pro standards. In the NFL, half of a player’s job was handed to someone else who was better at it. At the Olympics, the entries in the 400 meters and the 800 meters can be given to different athletes. In tennis, though, Isner’s gotta hit the returns, and Peque had to serve.
Player development, then, becomes a sort of optimization problem. Do you find the most extreme physical specimens you can, then coach them to adequacy in the skills that don’t come naturally? Or do you look for all-around talents, even if they’ll never hit a 140-mile-per-hour serve?
The answer isn’t obvious. But the trend is moving toward the latter. I think I can explain why.
In short, we’ve reached peak server. You could find players with the potential to develop bigger weapons than those of Sinner, Draper, Ben Shelton, Alexander Bublik, and the like. But they’re already holding 85% of the time. Even Ruud and Alex de Minaur, with their limited first-strike capabilities, are able to hold nearly that often. At the risk of a misleading pun, we’ve reached diminishing marginal returns. A better server might eke out another percentage point or two, but at what cost? A whole lot of guys would love to have Shelton’s serve, but would they take the Shelton return along with it?
Specialization is in decline because the floor keeps rising. A few generations ago, a one-dimensional savant with a monster serve or a wizardly backhand could rocket into the top 20 because not enough opponents could stop them. Now, Reilly Opelka might hit 30 aces, or he might get broken three times by #92 in the world. There are probably guys out there who could serve even bigger than Opelka or Bublik, or maybe even return better than de Minaur. But if they can’t meet a (steadily increasing) minimum level of competence on the other side of the ball, they’re marooned on the ITF tour, at best.
This, too, has parallels in other sports. Really, any sport where coaches are stuck with the same athletes on offense and defense. In the NBA, versatility is prized like never before. In baseball, teams are less likely to carry a slugger who is a liability in the field. There are just too many other options: Why use a limited player when an almost-as-good hitter could give you considerably better defense?
Think about it: In the ATP top 50, are there any bad servers? A few South Americans, plus Corentin Moutet. Learner Tien has some development yet to come, and that’s about it. Bad returners? Sure, a few, but any as weak as Isner was? (Or, heaven forbid, as Ivo Karlovic?) When Opelka was coming up through the ranks, everyone raved about how his backhand was in another class than Isner’s. Shelton’s game is incomplete, but he has a lot of skills on the ground. No one would call him hopeless out there. All of his natural talent and hard work translated to 47th out of the top 50 this year in break percentage.
Some of this is thanks to equipment. Modern rackets and strings make it possible to return more first serves, with control. Those thread-the-needle passing shots that everyone can hit these days? A couple of generations ago, they were little more than swing-and-pray low-percentage lunges. Technical advances benefit everybody, but they probably do more to shrink the gap between the haves and the almost-haves than they do to increase it.
Beyond that, we’re watching the natural outcome of an individual sport with an ever-expanding talent pool. Hyper-specialization won’t get you to the top, so well-roundedness is the only option. With millions of kids growing up watching Carlos Alcaraz, the bar will continue to rise on both sides of the ball.
I got an email this week, from Peter S., asking this question. There are a few reasons.
Peter zeroed in on a first-rounder at the Temuco Challenger, between Milledge Cossu and Alafia Ayeni. Ayeni is ranked 731, Cossu in the 1600s. Betting markets had Ayeni as a heavy favorite; my forecast gave Cossu the edge. Sportsbooks, unsurprisingly, had this one right, as Ayeni needed just 68 minutes to advance.
My forecasts are based on my Elo ratings, and my Elo ratings take into account all tour-level and tour-level qualifying, plus all Challenger main-draw results. (For women, I consider ITFs down to the $50K level.) For most players that you’ve heard of, that means that my Elo ratings are looking at every match they play. But for the likes of Ayeni and Cossu, it’s the opposite. The majority of Ayeni’s results this year have come at the ITF level. Cossu doesn’t have many pro results, period.
Point being, my forecast for a match like that is based on too little information to be anywhere near reliable. It might agree with the betting market, but only by happenstance. Ayeni has a poor recent record in Challengers, while Cossu hasn’t played any. By the logic of Elo, even starting a newbie at a fairly low rating, that makes Cossu the favorite. Give them both a dozen more matches, and the kinks would be ironed out, but we don’t get to do that simply for the sake of science.
Maybe I should indicate that more clearly on the forecast pages. (Or maybe I should include ITF results, too. Lots of stuff I should probably do.) In the meantime, you can check my Elo ratings leaderboard. Neither Ayeni or Cossu even appears, indicating that neither has played ten matches in the last 52 weeks that contribute to their rating. Ayeni is close to that threshold, so his rating (1166) is probably in the ballpark. Cossu is an unknown quantity. If players aren’t on that list, their forecasts aren’t going to be as accurate as those for players who are.
Outside the model
For extreme gaps between my forecasts and betting odds, limited data is usually the answer. You’ll often find smaller–but still puzzling–gaps, even between players with extensive track records.
It’s worth considering what’s “in” the model. Elo looks at match results–period. Has the player won or lost lately, and against whom? My single substantial tweak to that is an injury/absence penalty, so if someone misses a lot of time (minimum eight weeks during the season), they get docked. The assumption is that they’ll come back rusty or still physically compromised. The size of the penalty is based on player results after past absences. Though of course not all absences are alike, and players differ in how they handle them.
For player who haven’t missed time lately, any “news” isn’t going to show up in the forecast. If word leaks out that Alcaraz is dealing with a bum ankle, betting markets will adjust, but my forecast will not.
If players have missed enough time to trigger the penalty, their Elo ratings are less reliable until they’ve gotten several matches under their belt. When Sinner came back from his doping ban, he was surely in better shape than the typical guy who had just sat out three months. Same story with Djokovic’s layoffs-by-choice this season. On the flip side, a player who comes back too soon, perhaps treating a 250 as a mere trial run, is less likely to win than his adjusted Elo rating suggests.
Surfaces
Another major factor outside my Elo model is the specifics of surface. Not all hard courts are created equal, and I don’t even differentiate between indoor and outdoor. (I know, another thing you want me to do.) My forecasts probably underestimated Sinner’s chances of breezing through the last several weeks of the season because they did not recognize that indoor Sinner is reliably better than outdoor-hard-court Sinner.
Even among outdoor courts, speed varies enormously. Some players are considerably better on faster or slower courts, even if they are the same type. When Rafael Nadal was winning 1.2 million consecutive matches at Roland Garros, my model always considered him the favorite, but not by the overwhelming margin that bettors (rightly) did. Part of the reason was that the Paris clay is reliably slow, while Nadal was more vulnerable at, say, Madrid. So my Elo ratings, tossing all of his clay results into the same bucket, saw Rafa as (barely) beatable, even though it took an act of God to dislodge him at the French.
In short, if a player is particularly well-suited to the conditions at a certain tournament, Elo isn’t going to pick that up. He’ll be underrated in the forecasts. The degree depends on the player, and on just how well-suited he is.
There can also be an issue with limited surface data, most often–but not always–during grass season. Young players on the rise might show up at Wimbledon qualies without ever having played a professional match on grass. Their overall (surface-agnostic) rating will tell us something about their level, and my model makes an adjustment for their grass inexperience. But that sort of player could be anything from a grass natural to a hopeless case. Some of that might be predictable to a savvy fan, but Elo doesn’t have a clue.
Financial advice
If you’re using my forecasts as betting advice, stop doing that. C’mon, man.
If you check my forecasts for entertainment purposes, it’s good to know exactly what you’re looking at, and what the numbers are based on. Hope this helps!
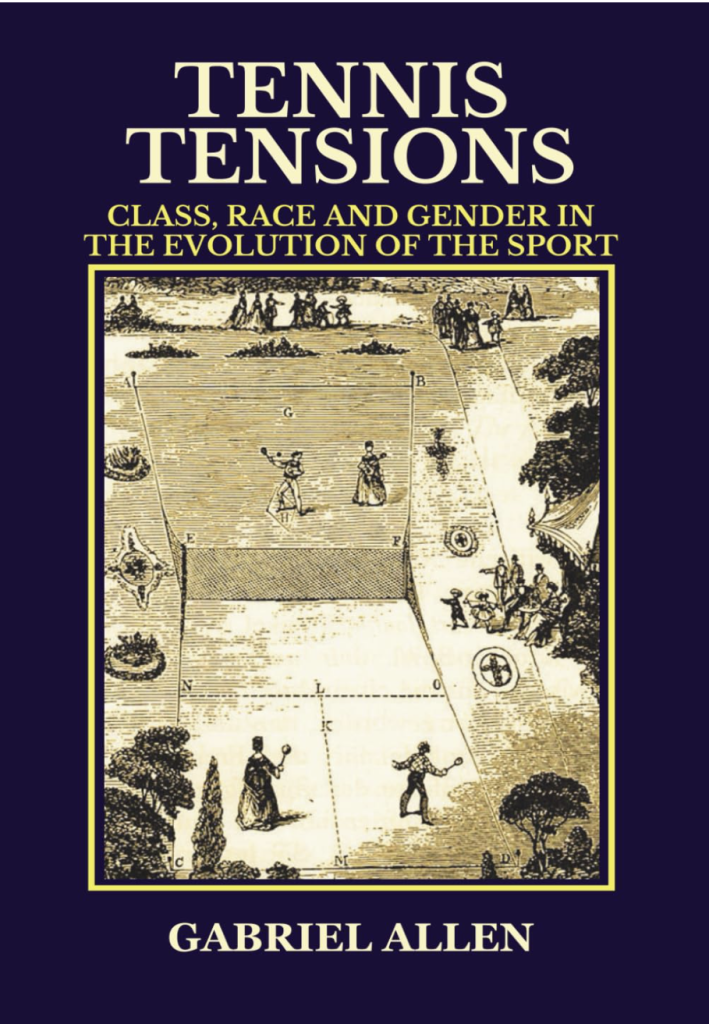
In his new book, Tennis Tensions, Gabriel Allen cites Olympic rower Anita DeFrantz: “Sport doesn’t lead society, it reflects it.”
This is closer to the truth than many people in the sports world would like to admit. For all the heroics of an Althea Gibson or Billie Jean King, there is only so much you can do with a tennis racket. More often, breakthroughs on the playing field come only when society is ready for them–and sometimes, as Gibson could attest, much later.
Allen organizes his book around the notion of a “white tennis unconscious,” a sort of privileged conventional wisdom that has influenced the sport’s rules and views since the early days of lawn tennis. (I, apparently, am one exponent.) I prefer a history of tennis that is less racially caricatured and more aware of the plethora of perspectives present at every step of the last century and a half. Still, Allen’s framework is a useful one to trace how and why Major Walter Wingfield’s “invention” of lawn tennis transformed into the game as we know it.
Wingfield’s game was a packaged product, a small set of equipment you could set up on a lawn that was already mowed for croquet. It owed a lot to badminton and a contemporary game known as “rackets.” But since badminton had come to Britain from India and rackets was associated with the lower classes, Wingfield called it something else. “Tennis” invoked real (or royal) tennis, a sport of kings, with associations that were more likely to appeal to the target market.
To his credit, the Major was a flexible man. As lawn tennis grew in popularity, practitioners and clubs began tweaking the rules. Wingfield proposed a second serve, as long as the first ball cleared the net and landed somewhere within the court; a rival set of rules axed the second serve entirely. Those who wanted a faster-paced game–one a bit less like badminton–sought to lower the net.
Allen walks us through these changes, showing how the prevailing mores of Victorian England pushed the game in certain directions. Tennis gained popularity as a game that could be played by both men and women: It was a great time for mixed doubles. The flip side, though, is that the game gained a reputation as a “sissy” sport. So the net came down … and came down some more … and came down still more, allowing for more powerful strokes. The service box was moved to mitigate the server’s advantage, but the second serve stayed, allowing physically strong players to go for broke without too much risk.
The organizers of the first Wimbledon championships imposed many of these rules unilaterally. Most revealing, not to mention galling, in Allen’s view, was what the club did to the scoring system. Wingfield’s suggestion came from rackets: First to 15 points, with points only won by the server; when the receiver won a point, they would gain the right to serve. You didn’t have to win by two, but at 13-all, the receiver could decide to play to 18, and at 14-all, the receiver could decide to play to 17. Soon after, the Marylebone Cricket Club settled on a simpler alternative of first to 15, win by two.
Maybe because of its simplicity, the scoring scheme reeked of lower-class games. Wimbledon imposed the old real tennis system: the sets, games, deuces, and ads we know today. Not everyone was pleased–even some early champions expressed their displeasure–but the traditionalists won the day. 148 years later, we’re still playing 40-point games.
Allen sees the decision as “classist” (a fair assessment) and the scoring system “beyond remedy” (more doubtful). He considers the standard rules too complex and sees it as not “equitable” that a player can win more points than their opponent and still lose the match. After rejecting several other alternatives, such as no-ad and Fast4, he introduces his own concept, the “Tiebreaker Match,” which is exactly what it sounds like. Typical tiebreak rules, but played to 60 or 100. No structural imbalances, and it’s impossible for the point-total winner to lose the match.
I don’t quite understand what’s inequitable about the scoring system: Nobody ever said the object of tennis was to win the most points, just as the goal in baseball isn’t to tally the most hits, or the ultimate object of ice hockey to minimize turnovers. It might feel unfair to the point-total-champion of the day, but it’s not some sort of insidious bias. Both sides have the same opportunity to win the match while losing on points.
More importantly, the quirky old rules work. We don’t really know why some games gain traction and stay popular while others don’t. Simplicity is rarely an advantage: Try explaining the rules of baseball, or the intricacies of the off-sides rule, then tell me that “15-30-40-game” is too much. I’m happy to grant that real tennis scoring was imposed on lawn tennis for the wrong reasons, but I don’t see that as poisoning the word “deuce” for ten generations. Had Wimbledon left the nets up high and stuck with first-to-15, we might have had another croquet on our hands. Carlos Alcaraz would be an up-and-coming midfielder for Real Madrid.
Once the scoring proposal is out of the way, Allen returns to his history. We get a useful recap of how amateurism was manipulated by the elites, peeks at couple of famous rivalries, and GOAT cases for Ora Washington and Richard Gonzalez. Tennis Tensions offers plenty of insights into how the sport has reflected society, especially in the early days, when a few Victorian men made decisions that continue to define modern tennis.
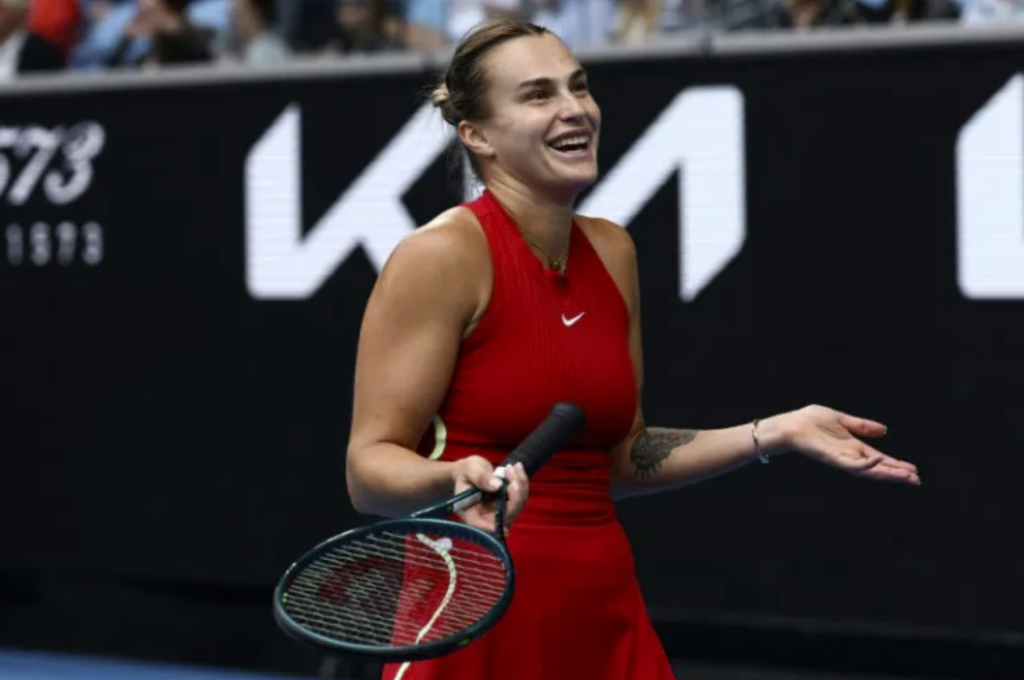
Aryna Sabalenka has won her last 19 tiebreaks. She’s 21-1 on the season. The record is so improbable, so mind-bending, that I barely know where to start.
The win streak has a near-precedent: Andy Roddick won 18 in a row in 2007. As for the win total: John Isner once won 44 breakers in a season, and she won’t touch that. But among women, she set the record a month ago. The previous single-season mark was “only” 16. Even that required a superhuman effort, as Billie Jean King played 127 matches in her record-setting 1971 campaign.
Women don’t play as many tiebreaks as men do, though Aryna is helping to narrow the gap. About one in five ATP singles sets ends in a tiebreak, and servebots occasionally double that. On the WTA tour, only about one in eight sets end in a tiebreak. While Ben Shelton has racked up 41 breakers since the beginning of the year, no woman has played more than 23.
(That’s right–Sabalenka hasn’t played the most! Elena Rybakina and Clara Tauson have reached six-all 23 times each, while Aryna stands at 22. Rybakina and Tauson are among several women who play tiebreaks more frequently, as a percentage of sets, than the world number one does.)
The smaller denominators make such a streak even more difficult to sustain. Roddick reeled off his 18 wins in a five-month span. Sabalenka’s string goes back to early March. When Serena Williams put together ten straight in 2013-14, it took her more than a year. She never won more than eleven in a season, or even played more than 16. Aryna’s 2025 effort is uncharted territory.
Great expectations
Tiebreak streaks are so fascinating because tiebreaks are the tennis equivalent of a coin flip. If a set gets to six-all, the competitors are fairly evenly matched. (At least on the day, up to that point.) And the first-to-seven format means that there’s little time for the superior player to set herself apart. When Sabalenka beat Rybakina 7-6, 3-6, 7-6 in Berlin, each tiebreak needed 14 points for Aryna to pull narrowly ahead.
Breakers aren’t true coin flips. It’s rare that both women have precisely a 50% chance of winning. The stronger player (whether by ranking, surface preference, or execution on the day) is more likely to pull it out. But her chances are usually closer to 50% than whatever black magic the Belarusian has summoned this season.
Long-time readers know I have a stat for this: Tiebreaks Over Expectation (TBOE). By looking at a player’s winning percentages on serve and return points for an entire match, we can calculate the probability that–given those same win rates–she’ll eke out the tiebreak.
Take the Rybakina match as an example. Considering the entire contest, Sabalenka won 56% of serve points and 39% of return points. Plug those into a tiebreak win-probability model, and it works out to a 43% chance of winning a tiebreak. In such a close match, the most likely outcome would have been for the women to split the two breakers. But Aryna stepped up her game on the bigger points and took both.
A 57/43 split is typical. This model sees about half of WTA tiebreaks as somewhere between 50/50 and 60/40 propositions. Fewer than one-tenth are more extreme than 70/30.
In other words, we should be surprised to see a season-long tiebreak record so far above 70%. (Especially since it’s not always the same players with the 60/40 edges. Aryna was on the wrong side of that 57/43 split.) And in time, these things tend to even out. Serena’s career tiebreak win percentage was 66%. Djokovic and Roger Federer are tops among men at 65%.
Buster-busting
Sabalenka, may I remind you, currently sits at 95%.
The TBOE model says that she “should” have won far fewer, for a respectable but hardly noteworthy 13-9 mark. Here are the women with at least ten tiebreaks who are at least two wins above expectations this season:
TBExp is the number of expected tiebreak wins (13 instead of 21 for Aryna), and TBOE is the number of actual wins beyond that number (21 is 8 more than 13). Sabalenka’s 2025 figure is nearly double the next “best” (or clutch-iest, or luckiest, or whatever) on the list.
I have the data to calculate TBOE back to about 2010. Nobody else from the last decade and a half of women’s tennis even comes close to what the Belarusian is doing:
On a percentage basis, some of these seasons stack up with Sabalenka’s. But it doesn’t work like that: 13-2 doesn’t imply 26-4 given twice the chances. After Saville’s standout 2018, she came back in 2019 and won just one of five tiebreaks. Kuznetsova won 12 of 14 in 2017, then stumbled to 2-3 the following year. By contrast, Aryna won 13 of her first 14… and then the next eight, too.
One more list to put this crazy season in perspective. I have men’s TBOE numbers back to 1991. In 35 years, even with many more tiebreaks, only four men have ever won more “bonus” breakers in a season than Aryna has in 2025:
Year  Player             W-L  TBExp  TBOE
1994  Jacco Eltingh     33-9   22.3  10.7
2010  John Isner       32-17   22.7   9.3
2015  Stan Wawrinka    34-12   24.9   9.1
2009  John Isner       27-12   18.5   8.5
2025  *Aryna Sabalenka  21-1   13.0   8.0
2012  John Isner       38-18   30.0   8.0
2016  Ivo Karlovic     42-26   34.0   8.0
2004  Andy Roddick     34-11   26.1   7.9
2017  John Isner       42-26   34.3   7.7
2014  Milos Raonic     38-13   30.4   7.6
1995  Thomas Muster     27-7   19.5   7.5
John Isner was good at tiebreaks.
The mean beckons
Notice anybody missing from that last list?
Roddick’s 2004 tiebreak campaign rates as one of the best ever, but what about 2007, when he won 18 in a row? From the Wimbledon quarter-final, when Richard Gasquet broke his streak, to the end of the year, he won just 11 of 20 tiebreaks. The overall tally, a TBOE of +5, was excellent but not otherworldly. Ivan Ljubicic, lacking any claim to the history books, won more bonus breakers that year.
It’s tempting to look at Sabalenka’s tiebreak record and pay tribute to her nerves of steel, her grace under pressure, her ferocious first serves. Some of those plaudits she absolutely deserves. Whatever the model says, she executed, she won those points, and her opponents–some of them among the best players in the game–did not.
Still, clutch in tennis is a fickle thing. The tiebreak streak makes a compelling claim that Aryna has been as clutch as anybody. But a player who reliably steps up under pressure isn’t just going to do so with the score at six-all. Take break points. Sabalenka wins more break points than overall return points (almost everybody does), but by a smaller margin than the typical player. By that measure, she’s slightly worse than average under pressure. That helps explain how she’s gotten herself into so many tiebreaks in the first place–15 of 22 against opponents outside the top 20.
The question isn’t whether Sabalenka deserves her record. Again, she hit the shots, she won the matches. Case closed. More interesting is what to expect going forward.
As we’ve seen, a list-topping season doesn’t say much about the future. (Unless you’re John Isner.) Saville and Kuznetsova fell flat after their strong tiebreak campaigns. Post-streak, Roddick came back to earth. Jacco Eltingh followed his impressive 1994 season with a pedestrian 14-11 record in breakers the next year. In the moment, it’s tough to separate clutch from good fortune. In the longer term, it doesn’t matter. Whatever it is, it is fleeting.
For Sabalenka, then, the simplest projection is that she’ll fall back to a tiebreak winning percentage around 60%. It will depend a bit on who she faces, and with only a couple dozen breakers per season, a bit of good or bad luck could swing that ten percentage points in either direction.
There is, however, reason for a bit more optimism. 2025 marks Sabalenka’s fifth straight season of better-than-expected tiebreak numbers:
The 2021-24 samples are small, and none of the overperformances are anywhere near what she has done this year. Still, a handful of players (Isner, Federer, Djokovic) have managed to consistently step up their games in tiebreaks, even if the vast majority of their peers do not. While big serving is not itself an advantage, it does help if you can serve as big in tiebreaks as in the rest of the set–a trick that surprisingly few players have mastered. That may explain some of Aryna’s success.
Even the more optimistic view would still project Sabalenka to win about two-thirds of her tiebreaks. When the streak finally ends, she–like Serena and Novak before her–will have to settle for that.
Aryna Sabalenka typically has things more under control, even on clay.
For a while there, it seemed that Aryna Sabalenka and Iga Swiatek would divide the spoils. Sabalenka would dominate on hard courts, and Iga would continue her reign on clay.
At the moment, Aryna is taking it all. She has held the number one ranking for six months now, opening up an astonishing 4,300-point gap on the field. She picked up her third Madrid title on Saturday, straight-setting Coco Gauff shortly after Gauff dealt Swiatek one of her worst-ever clay-court losses. My Elo ratings not only put Sabalenka atop the field, they rank her first on clay. By Elo, at least, the Belarusian will be the favorite at Roland Garros.
Some of this can be explained by Swiatek’s struggles. But Sabalenka has long been ready to seize her chance. Here are her career tour-level results by surface:
This is not the snapshot of a player with a strong surface preference. She has reached ten career clay-court finals, winning three and losing four to Iga.
On the other hand, all three tournament victories (and more final) came in Madrid. Four more of the finals were in Stuttgart. Both events have historically favored bigger hitters: Madrid with its altitude, and Stuttgart with its predictable indoor conditions. Rome and Roland Garros present different challenges.
So, is Sabalenka the new queen of clay, or is her domain limited to the Spanish capital? Is she really the woman to beat in Paris?
(DR = Dominance Ratio, percentage of return points won divided by serve points lost.)
Madrid stands out as Sabalenka’s playground, and Rome is clearly not her favorite tour stop. But her cumulative stats at the French Open, where she has reached only one semi-final and one other quarter, fit better with the tournaments where she has reached so many finals.
You probably remember Aryna’s tough 6-7, 6-4, 6-4 loss to Mirra Andreeva in last year’s final eight. I had forgotten that it was her fifth straight three-set exit in Paris. Two years ago, it took Karolina Muchova more than three hours to advance to the final. Back in 2020, Sabalenka won more points than Ons Jabeur did in their third-round meeting, yet it was the Tunisian who moved on.
The parade of narrow losses isn’t a case for the Queen-of-Clay title–after all, Iga would’ve won some of those matches in about 56 minutes. It’s merely a reminder that the world number one has often been close. She is playing somewhere near her best-ever tennis right now, so if the improved form carries over to Roland Garros, it’s easy to imagine those close matches finally tipping her way.
Surface insensitivity
Here are some (men’s) surface-speed ratings from the last 52 weeks. Stuttgart is a women’s only event, so I’ve included Hamburg as a rough approximation:
Year  Event          Surface Speed
2024  Roland Garros           0.66
2024  Rome                    0.67
2024  Madrid                  0.82
2024  Hamburg                 0.89
(I use men’s data for surface speed because the metric is based on ace rate. Men hit more aces, so there’s better data to assess court conditions.)
Tour average, across all surfaces, is 1.0. Speed ratings in the 0.8 to 0.9 range are slow-ish, but they’re more like a slow hard court. For instance, the men’s Masters event in Montreal last year rated a 0.8, almost identical to Madrid. Point being, there is a clear separation between the traditional clay events and the upstarts. It would stand to reason that a big hitter like Sabalenka would struggle more in Rome and Paris.
Despite the trophy count, surface effects don’t show up where I would expect to find them in the stats. The Match Charting Project–thanks to one unhealthily obsessed contributor–has logged almost all of Aryna’s tour-level matches. Based on that data, here are her average rally lengths by event:
Event          Avg Rally
Roland Garros       3.54
Rome                3.25
Madrid              3.30
Stuttgart           3.14
Sabalenka has defied the slow dirt at the Foro Italico. She has somehow played even shorter points there than in Madrid. We can give some credit to her opponents–she has faced Jelena Ostapenko, Dayana Yastremska, and Danielle Collins there–but even her 2022 match with Iga registered just 3.1 strokes per point.
The same trends–or lack thereof–show up in her serve stats. The next table shows the rate at which Sabalenka’s serves are unreturned, and the percentage of points that she wins with either her serve or her second shot:
Event          Unret%  <=3 W%
Roland Garros   27.2%   46.9%
Rome            31.6%   49.0%
Madrid          30.4%   49.6%
Stuttgart       36.0%   54.0%
Though Stuttgart is a server's paradise, the gap between Madrid and Rome remains slim. Looking at these numbers, you'd never know that Sabalenka had three titles at one of the events and a 9-6 career record at the other. At the very least, it seems that the slow clay has not prevented the Belarusian from playing her game.
The dropshots
Last year, Sabalenka clay-court game changed. She hit more drop shots than ever, especially in Rome and Paris. My deep dive showed that the tactic was a success across multiple dimensions:
Clay-Sabalenka got the best of both worlds. She won more points by playing the drop, and she won more points because of the tactic’s lingering effect. Perhaps because of her growing reputation as a drop shot queen, the effect has persisted since June, even when she doesn’t go to the well so often.
In theory, dropshots give opponents something to think about, and the positive effect of a good dropshot goes beyond a single point. It's hard enough to handle Sabalenka-level power. Thinking you might have to dash forward makes it even worse. The post-dropshot effect doesn't work for everybody--it is neutral for Ons Jabeur, for example--but it has made Aryna even deadlier.
Expect droppers galore in Rome. Sabalenka unleashed eleven in the Madrid semi-final against Elina Svitolina and another eleven on Coco Gauff in the final. She won 14 of the 22 points. If it works in Madrid, it will almost definitely continue to score points on the more stately surfaces in Rome and Paris.
Sabalenka's new weapon remains a minor tweak, but it has clearly been a positive one. Few women gain so much from dropshotting as she did on slow clay last season.
Coronation?
All of this adds up to Sabalenka being the Roland Garros favorite--mathematically if not emotionally. If she is the new Queen of Clay, it's only by default. Swiatek is a generational talent on the surface: If Iga can play her best, Aryna will be lucky to push the final to three sets.
The case for the world number one, then, is more prosaic. Who could beat her? A resurgent Iga, of course. Andreeva could cause problems again: Perhaps no one else on tour can better neutralize the Sabalenka serve. Ostapenko could blitz her way through, as she did in Stuttgart, but she is even more of a threat to Swiatek than she is to Sabalenka. The luck of the draw is a very real factor when the Latvian is lurking.
The next two weeks in Rome won't overturn any of this, but they could refine the narrative. If Iga coasts to a fourth Italian Open crown, it will be tough to bet against her in Paris. If Aryna comes out on top, she would head to the French as more than just a mathematical favorite. If Ostapenko wins it, well, that would be pretty funny.
***
Subscribe to the blog to receive each new post by email:
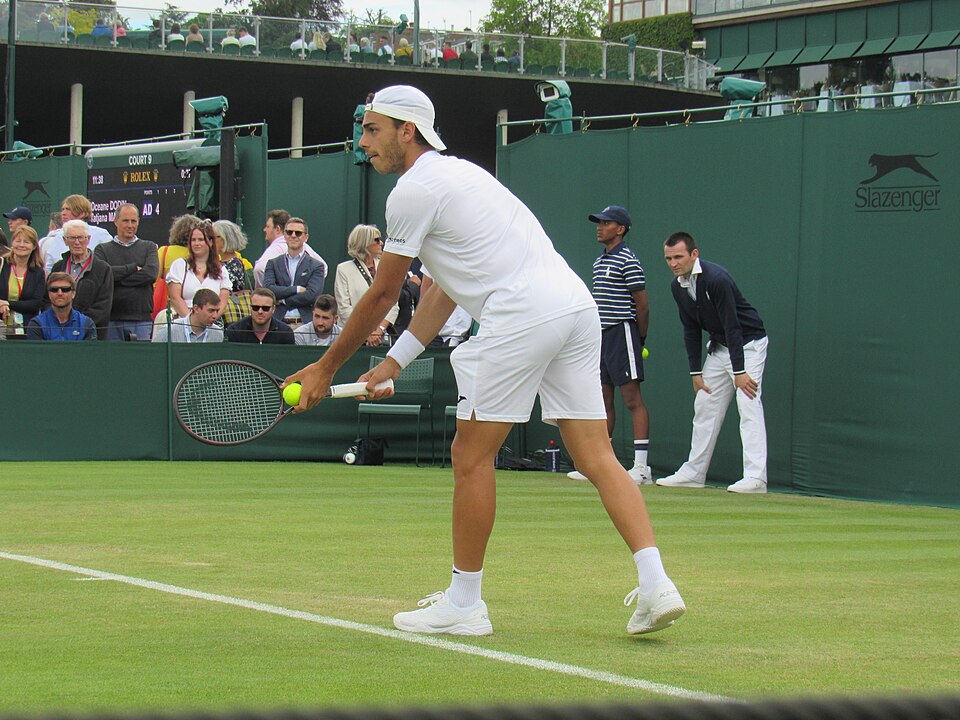
Francisco Cerundolo at Wimbledon in 2022. Credit: Jmmuguerza
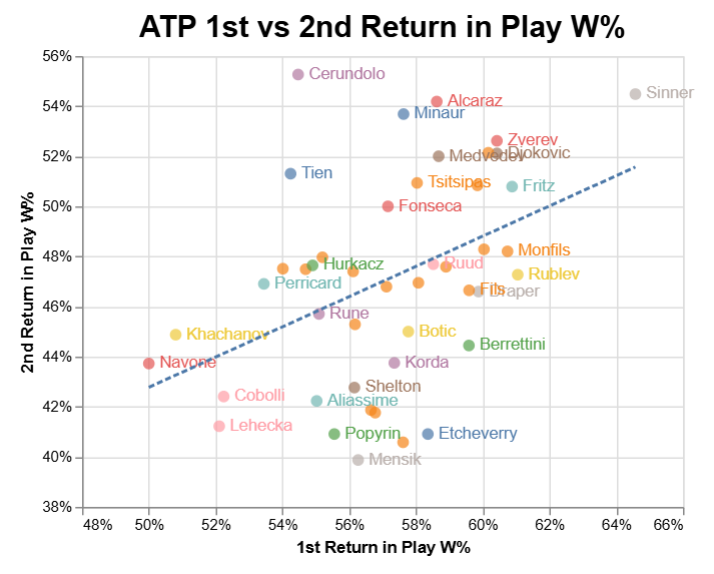
I remain mildly obsessed with Francisco Cerundolo’s second-serve stats. It started when I was writing about Jakub Mensik last month. Mensik is one of the worst players on tour at winning points when opponents return his second serve. Cerundolo is the best.
This graph compares points won when first and second serves come back. It is now five weeks old, but the numbers haven’t changed much:
Unfortunately for Cerundolo, this is not a particularly valuable skill. There’s a surprisingly weak correlation between win percentage on returns in play (for first or second serves) and win percentage overall. Men who hit a lot of unreturned serves often end up with mediocre return-in-play win rates, because they don’t have easy plus-one opportunities–those great serves don’t come back at all.
Cerundolo’s second serve almost always comes back. Only 14% have gone unreturned in the last 52 weeks. Of players with at least ten charted matches in that time, only Marcos Giron is lower. Average is 18%, and even Sebastian Baez is at 16%. The Argentinian’s second serve isn’t bad, it’s just not quite as much of a weapon, and his focus is to set up the rally in his favor.
It isn’t just about the return-in-play win rate, though. Cerundolo can rely on his second serve more than most of his peers–sometimes more than on his own first serve.
Trending up
Over the last year, Cerundolo’s second-serve winning percentage is 53.1%, good for 19th among the top 50. (That doesn’t count stats from the ongoing Madrid tournament.) Nothing special, though still a respectable number for a guy whose serve is not his foremost weapon.
In 2025–still not counting Madrid–he’s up to 54.1% and 14th place, a couple ticks behind Jack Draper. Tack on his four wins so far at the Caja Magica, and he’s up to 55.5%.
Like many guys with games tailored for clay, the gap between Cerundolo’s first and second serve stats is smaller than average. Going back to the last 52 weeks, here are the top ten smallest ratios between first- and second-serve win percentages, along with tour average and the man at the other extreme, Mensik:
Player               1st%    2nd%  2nd/1st
Sebastian Baez       63.6%  50.4%    0.792
Carlos Alcaraz       73.4%  56.7%    0.772
Davidovich Fokina    67.2%  51.9%    0.772
Lorenzo Musetti      69.7%  53.2%    0.763
Tommy Paul           71.9%  54.8%    0.762
Francisco Cerundolo  69.7%  53.1%    0.762
Tomas Machac         69.8%  53.0%    0.759
Casper Ruud          71.4%  53.8%    0.754
Holger Rune          73.0%  54.9%    0.752
Alex de Minaur       73.4%  54.5%    0.743
…
Top 50 Average       73.6%  52.4%    0.712
…
Jakub Mensik         76.5%  46.6%    0.609
By the end of that list, you’ll have to knock the clay off your soles. This is another metric in which Cerundolo is reaching new heights this season. So far in 2025 (including Madrid), he’s won 70% of firsts and 55.5% of seconds, for a ratio of 0.793, just edging out Baez.
These narrow gaps aren’t really about good second serves. They reflect game styles built around modest first serves and strong baseline play. Most serves come back, and when they do, it doesn’t matter much which serve kicked things off.
It’s also just what happens on slower courts. The average top-50 player sees his first-serve win rate drop to 70% on clay, resulting in a ratio of 0.744–just about even with Alex de Minaur.
High seconds
The quirks that got me hooked at Cerundolo’s second-serve stats are the occasions when he wins more second-serve points than first-serve points. He did it against Tommy Paul at Indian Wells, in his semi-final loss to Ben Shelton in Munich, and again to kick off his Madrid campaign against Harold Mayot.
This is another clay-court kind of thing. Since the beginning of last season, only two men have accomplished the feat more often than the Argentinian has:
Player               Matches   2>1s
Sebastian Baez            76     12
Casper Ruud               91     12
Francisco Cerundolo       87      9
Mariano Navone            61      8
Davidovich Fokina         67      8
Lorenzo Musetti           81      8
Alex Michelsen            81      8
Alex de Minaur            92      8
Once again, the stat has as much to do with pedestrian first serving as it does with strong second-serve execution. Since the start of 2024, the player who has won 60% of his second-serve points most often is Jannik Sinner. Despite clearing that line 44 times, his second-serve win rate has never been higher than his first-serve mark.
When Cerundolo is at his best, no serve–first or second, his or his opponent’s–matters much. Here are his win percentages by rally length over the last 52 weeks:
Length   Win%
1 to 3  47.6%
4 to 6  50.1%
7 to 9  50.7%
10+     57.3%
The short-point stat tells us that Cerundolo doesn’t win as many quick serve points as his opponents do. Then, the longer the rally drags out, the more things tilt in his favor. Most players struggled to keep their ten-plus number much above 50%. 57.3% is outstanding, highest among any player with at least ten charted matches.
Second thoughts
None of these numbers identify any unique superpower. Cerundolo is a throwback clay-court specialist, much like his coach, Pablo Cuevas. He serves because he has to, then he launches inside-out forehands until his opponents finally surrender.
The skills I’ve isolated do a great job explaining yesterday’s defeat of Mensik in the Madrid quarterfinals. The match was close, with the Argentinian winning 94 points to Mensik’s 91. The Czech was two points from victory in the second-set tiebreak.
Yet despite occasional bursts of return aggression from Mensik, Cerundolo’s second serve never faltered. He won 21 of his 33 second-serve points, including 75% in the pivotal second set. His opponent hit 33 second serves as well, and despite averaging the same speed on those deliveries–96 miles per hour–Mensik won only 14.
That’s more than enough to explain the end result. Long-rally prowess will do the job, too. Mensik entered the match with a 11-4 tiebreak record on the season. When I wrote last month about the Czech’s performance in breakers, I pointed to his ability to keep points short, something that most players are unable to do under end-of-set pressure. Well, in yesterday’s second-set tiebreak, Cerundolo got enough balls back to push the average rally length to 5.6 strokes. He took Mensik’s biggest weapon off the table.
In today’s semi-final against Casper Ruud, Cerundolo faces a different challenge entirely. As we’ve seen, the Norwegian is another player for whom the serve is little more than a formality. Last time they met, in Miami, it was Ruud who won more second-serve points than firsts. Today’s meeting may give us more quirky stats, but the serves themselves are unlikely to tell much of the story.
***
Subscribe to the blog to receive each new post by email:
Are Paula Badosa and Emma Navarro actually the same player?
Every so often, an analyst introduces a new way to classify playing styles. The approach usually involves taking a bunch of different stats and identifying clusters of more or less similar players. One group might be aggressive, flat hitters; another might be clay-court experts; a third might be serve-plus-forehand specialists.
Two problems. First, tennis stats tend to be highly correlated. If you’re good at one thing, you’re probably good at most other things. Second, the stats we have aren’t that great. Sometimes we get goodies like spin rate and shot speed from broadcasts, but that’s the exception. Instead, we have to build classifiers from pedestrian metrics like second-serve win rate or–at best–charting-based stats like Backhand Potency and Aggression Score. All of these things are tied to points won, which brings us back to the correlation problem.
I don’t have a solution. I do, however, have a zany idea that might just yield some insights. Instead of classifying players by the most granular metrics we have, what about identifying styles from results?
If two players have the same unexpected head-to-head against, say, Iga Swiatek, they might just have something in common. If both players have similar unexpected head-to-head records against many opponents–not just Iga–it’s probably not just a coincidence, right? We might be able to look at their playing styles and see that they are troubling opponents in similar ways, but even if we didn’t know the first thing about their skills or tactics, we could spot the parallels in their results.
The concept is simple enough. The math is not, and more importantly, the results offer more questions than answers. It’s possible this is a dead end, but I can’t see far enough around the next corner to be sure.
Welcome to the matrix
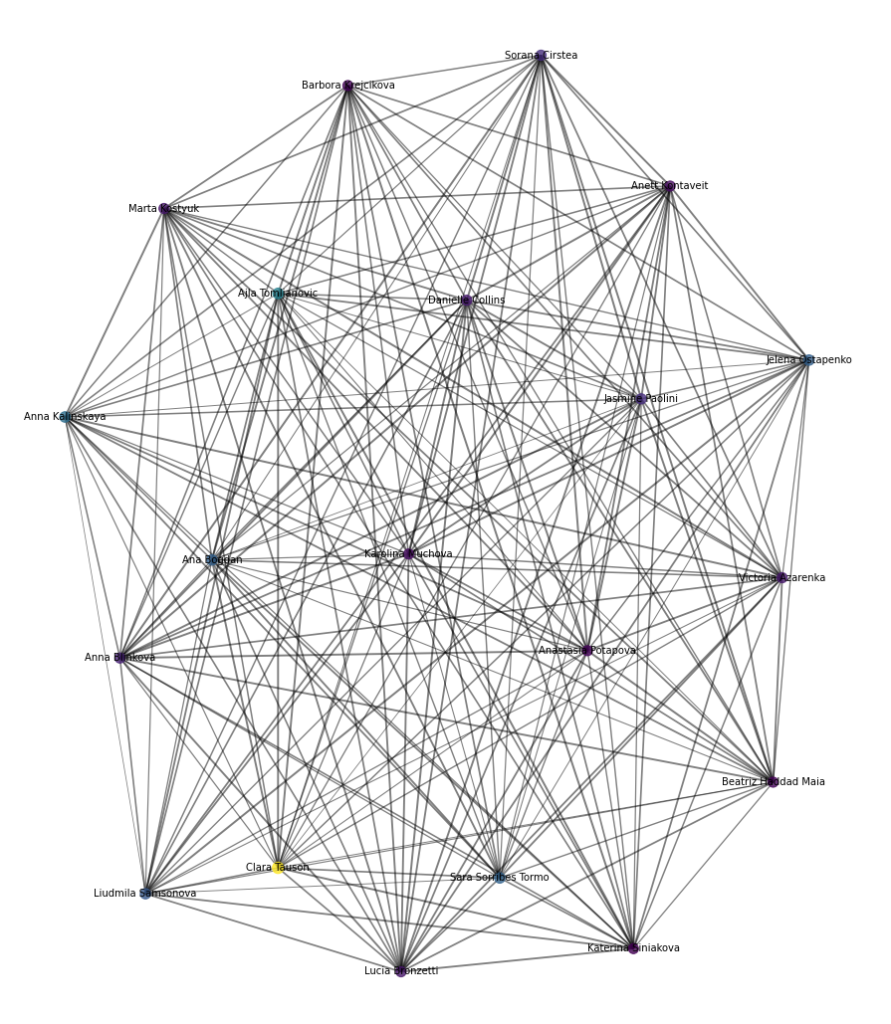
We’re going to dive into the weeds in a moment. Surely this network graph will entice you to come along?
Those are the 20 most “unique” players in the dataset. The degree of similarity between each pair of players is represented by the thickness of the line that connects them. (I know, you can’t really tell most of the lines apart.) Clara Tauson is a yellow dot because she’s by far the most unique of all.
We’ll come back to that, maybe.
Here’s how this works. I took the 60 players with the most tour-level wins since 2021 and found all the meetings among them. For each pair of players, I used pre-match Elo ratings to determine how “unexpected” the results were, and in which direction. For example, Elo ratings say Jelena Ostapenko usually has a ~20% chance of beating Iga, yet she has done so every time. Ostapenko’s score vs Swiatek, then, is +0.8, and Iga’s score for the same matchup is -0.8. Very few scores are so extreme. Most head-to-heads go roughly as expected, so they hover around zero.
Each player, then, has a score against every other player. Next, I use a method called matrix factorization to analyze and compare those sets of scores. Matrix factorization is commonly used in recommendation systems–if you and I give similar ratings to a bunch of movies and I like a new movie, you’ll probably like it, too. In tennis terms, say that Players A and B have unexpected results against many of the same players. If Player A upsets Aryna Sabalenka, Player B might have a better shot than we think to knock out Sabalenka as well.
In theory, this approach should capture some things about playing style, but it doesn’t actually know anything beyond the Elo-adjusted head-to-heads. Matrix factorization looks for efficient ways to characterize the relationships between players. Those might correspond to real-world attributes like “heavy topspin” or “attackable second serve,” but they might be incomprehensible to us lowly humans.
Mostly incomprehensible
The algorithm decided that the cleanest solution was to divide the 60 players into ten categories. I’ve numbered them, but the order doesn’t matter. Here’s one:
Almost as head-scratching as the Iga group. Are there any players you’d be less likely to group together than Caroline Garcia and Mayar Sherif? For what it’s worth, the algorithm thinks Badosa and Navarro are the two most similar players in the dataset.
We don’t need to comment on them all, but here are the rest:
If these groupings were based on traditional or charting-based stats, I’d assume there was a coding error. As it is, the clusters do not inspire confidence in this alternative method.
Style-ish
Those groups were determined by how players rated on three “style factors” that the algorithm extracted from all those head-to-head scores. Again, we don’t know what they correspond to in the real world, but each one is associated with how players over- and under-perform their ratings.
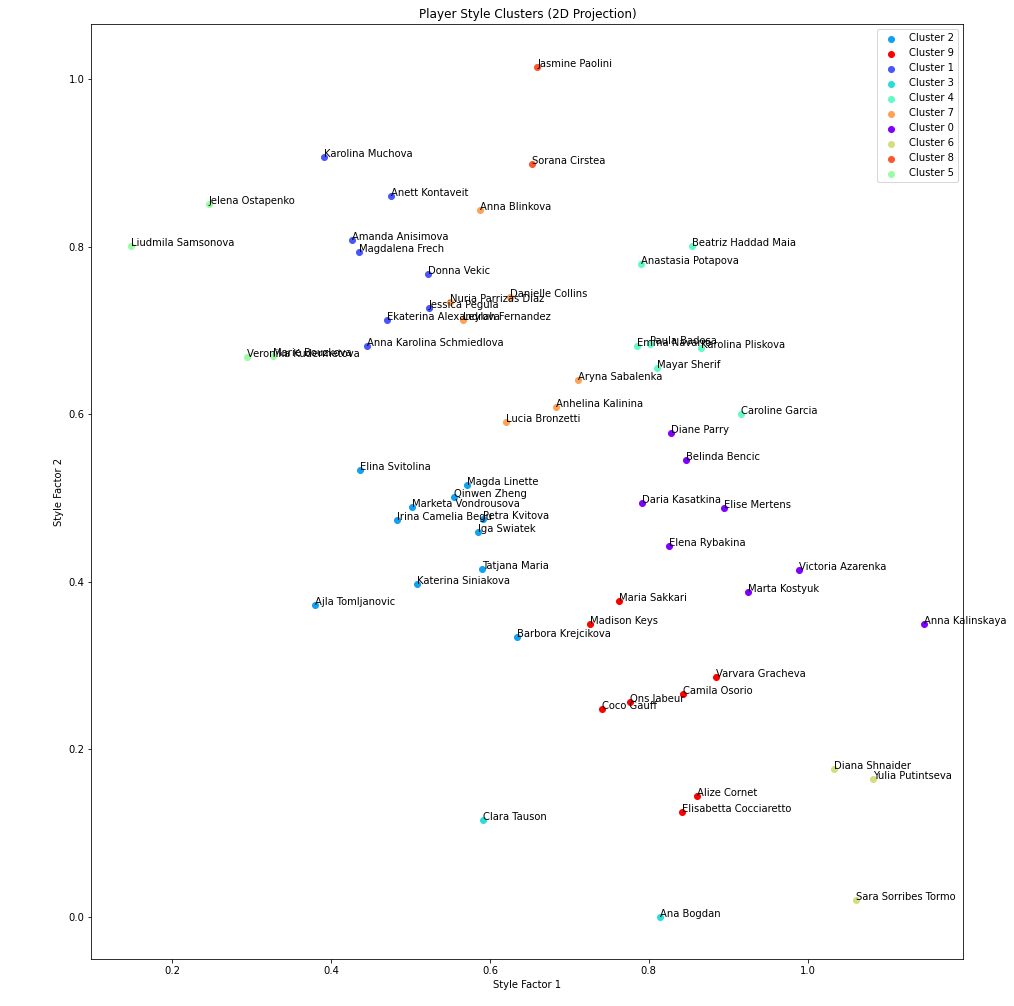
This plot shows how players measure up on the first two style factors:
Ostapenko and Samsonova in one corner, Sorribes Tormo (and Putitnseva, and Bogdan) in the other? This might actually make some sense! From left to right, we have a very approximate ranking of most aggressive to least aggressive, though with curveballs like Marie Bouzkova on the left side (hidden just to the left of Schmiedlova) and Garcia on the right.
Top to bottom is harder to parse. There’s some correlation between these two style factors, so there’s a whisper of aggression level there. But Paolini on top? I wouldn’t have thought there was any attribute, positive or negative, where she would stand out so much from the crowd.
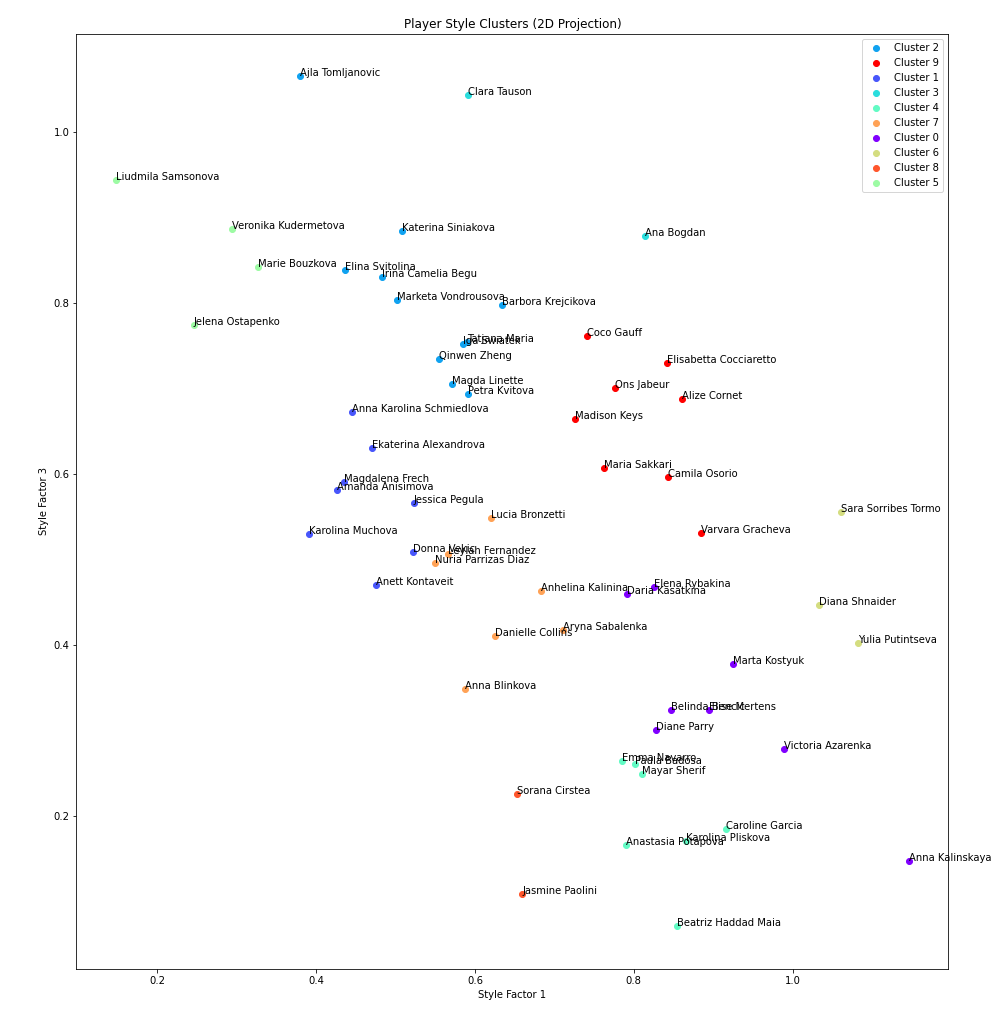
Here are scatterplots showing the first and third factors:
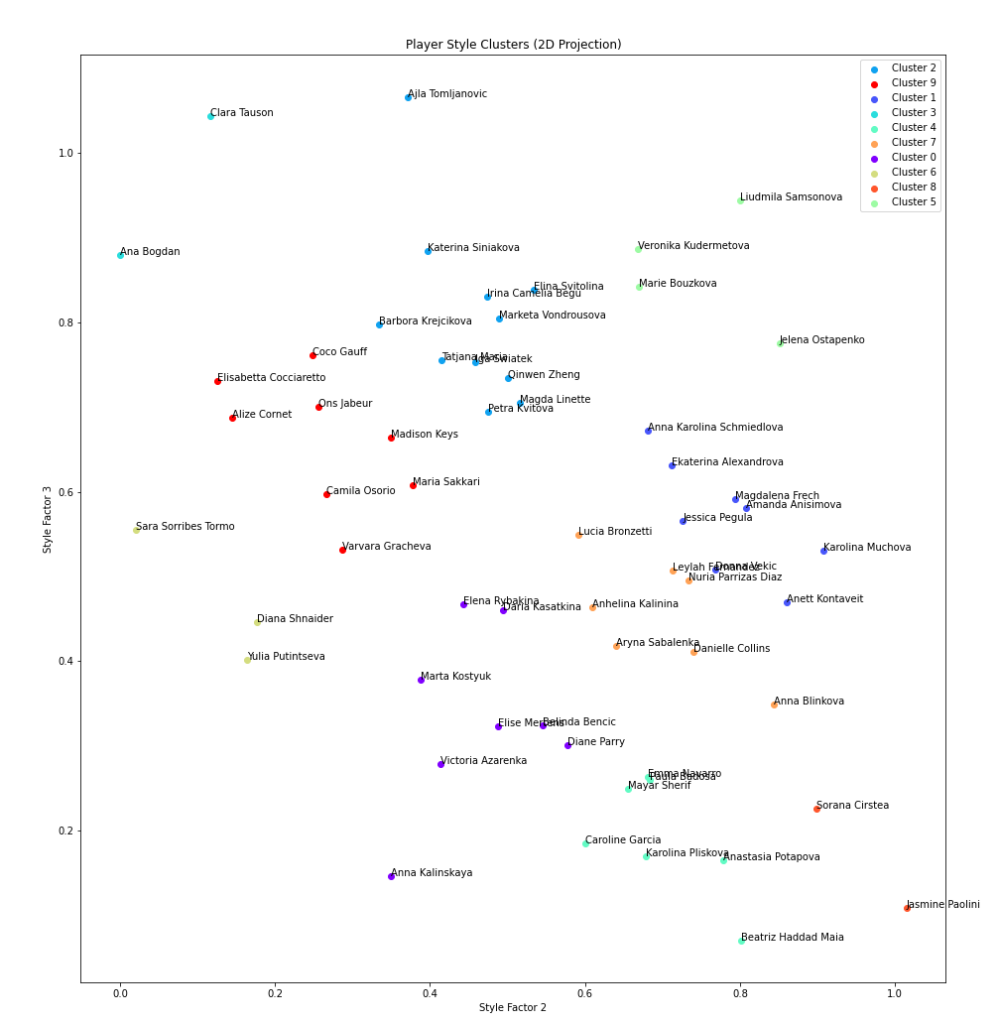
And the second and third:
I don’t know, man. Iga is hidden in the middle graph because she’s so close to Tatjana Maria. That pretty much says it all.
A game of matchups
Here’s the thing–this should work, right? Players have strengths and weaknesses that don’t change too much over time. They are susceptible to certain types of opponents, and they feast on others. People talk like this all the time: It’s why they say tennis is a game of matchups. Coco Gauff struggles against this sort of player, her next opponent is this sort of player. Upset watch!
It’s possible that my zany idea does work. We could use these clusters and similarity metrics to tweak the Elo prediction for each match and see whether the results improve. Incorporating head-to-heads in pre-match forecasts barely moves the needle, but that’s mostly because there are so few meetings between most pairs of players. Looking at clusters of players increases the sample size, even if there’s a cost in precision. While we might never figure out what these style factors mean, the proof would be in the forecasts. Maybe.
I don’t have it in me to run that test, at least not this week. Let’s imagine that we did, and that we discovered this was all a worthless exercise. Here are some possible reasons why:
Players change too fast. This might be why Paolini is such an outlier: She’s barely the same player she was a few years ago. Any attempt to characterize her will struggle to reconcile 2021-Jasmine with 2024-Jasmine. And she’s hardly the only one to have made noteworthy changes. What’s more, pros are plenty aware of their weaknesses. The type of opponent that bedevils Mirra Andreeva this year might be the focus of an offseason training block.
Players are streaky. I suspect that Tauson registers as so unique because she has won and lost in bunches. She reeled off seven in a row in January, but not because she lucked into the right types of opponents. On the flip side, she lost six straight last summer. In both cases, the streak was more about her form than about the styles on the other side of the net.
There’s not enough data. In theory, each player’s “profile” is a set of 59 head-to-head scores. But in the last four years, fewer than three-quarters of the possible head-to-heads have been played. Of those, about 40% consist of just one meeting. I’ve given the one-meeting scores less weight, but that’s still a lot of room for noise to take over the profiles.
Tennis isn’t really a game of matchups. I’m not willing to go this far, but I do believe that the “game of matchups” business is overstated. For every lopsided Ostapenko-Swiatek head-to-head, there are dozens more boring ones, 2-1 in favor of the better player. The “matchups” line is invoked more often after a match is over, as part of a post-hoc narrative. Betting lines hew far closer to style-neutral Elo ratings than to any kind of matchup/style profile.
Like I said, more questions than answers. I started this project with ATP data, and believe it or not, the results for men were even more puzzling.
If you think you know why Sabalenka is grouped with Anna Blinkova and Nuria Parrizas Diaz, the comments are open.
***
Subscribe to the blog to receive each new post by email: